
Page Contents
Last updated: October 2026
Driving more traffic is expensive. Turning the visitors you already have into customers is usually cheaper and faster, which is why conversion rate optimization strategies sit at the center of every healthy growth plan. Recent benchmark roundups put the average e-commerce conversion rate at roughly 2–3%, so even small gains can change revenue noticeably: moving from 2% to 2.5% means 25% more orders from the same traffic.
This guide explains how conversion rate optimization works and walks through nine strategies you can apply in 2026, with the research behind each one. Where figures come from secondary summaries and may vary by source, we say so.
How Does Conversion Rate Optimization Work?
Conversion rate optimization (CRO) is the process of increasing the percentage of visitors who complete a goal, such as buying, signing up, requesting a demo or subscribing. If you want the full background, read our complete guide to conversion rate optimization.
The formula is simple: divide the number of conversions by the number of visitors and multiply by 100. For example, 300 orders from 12,000 visitors is a 2.5% conversion rate. If you are unsure how to measure it for your own site, see how to calculate conversion rate.
Many teams assume the answer to low sales is more traffic. In practice, more traffic to a leaky page only multiplies the leak. A better approach is a repeating loop: collect data, find friction, form a hypothesis, test it and keep what works. The pages where this matters most are the home page, landing pages, pricing pages, product pages and the checkout.
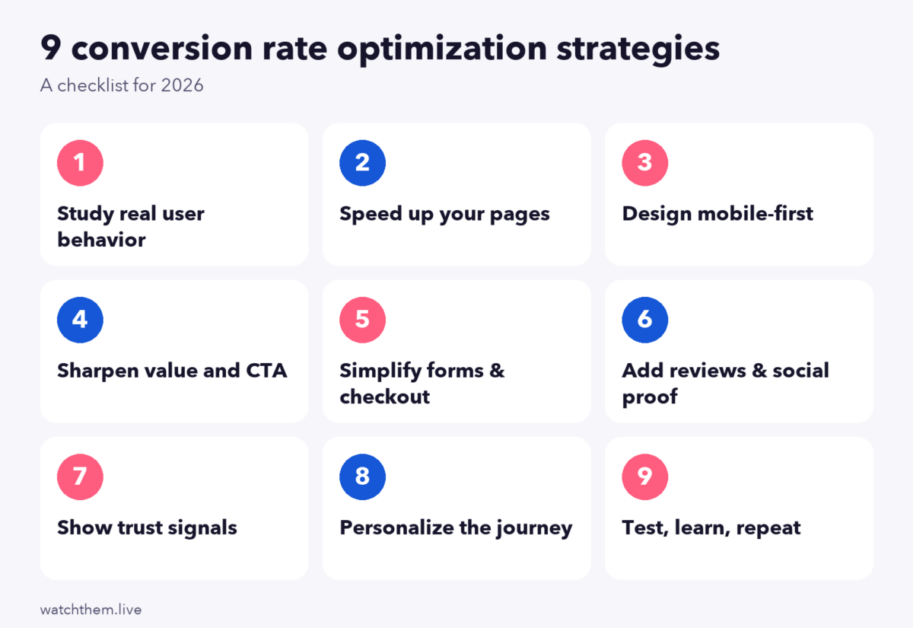
9 Conversion Rate Optimization Strategies for 2026
1. Study Real User Behavior Before You Change Anything
The most common CRO mistake is redesigning a page on opinion. Start with evidence instead. Analytics tells you where visitors drop off, but not why. Pair it with qualitative tools:
- Session recordings show where people hesitate, rage-click or abandon a form.
- Heatmaps show which elements get clicks and how far visitors scroll on desktop and mobile.
- Surveys and user feedback add the reasons in visitors’ own words.
- Console error tracking catches technical bugs that silently break a checkout.
Spend a week on this research and you will have a ranked list of real problems instead of guesses. A quick CRO audit can structure the process.

2. Speed Up Your Pages
Speed is a conversion factor, not just an SEO one. A well-known Deloitte study for Google, “Milliseconds Make Millions,” found that making mobile sites 0.1 seconds faster lifted retail conversion rates by about 8.4% and travel conversion rates by about 10.1%. A separate Portent analysis of over 27,000 landing pages found that pages loading in one second converted at several times the rate of pages loading in five. Portent’s work is a correlation study, not a controlled experiment, so treat the exact ratio as directional.
Practical steps: compress and lazy-load images, remove unused scripts, use a content delivery network (CDN), enable caching, and keep an eye on Core Web Vitals in Google Search Console.
3. Design Mobile-First
Mobile visitors are often the majority, yet they usually convert less than desktop visitors. One 2025 benchmark roundup reported desktop at about 3.9% against mobile at about 1.8%, though figures vary by source. That gap is an opportunity. Check your mobile pages with real devices and recordings:
- Make buttons large enough to tap, with space around them.
- Keep the main call to action visible without excessive scrolling.
- Use mobile-friendly input types, autofill and digital wallets at checkout.
- Avoid pop-ups that cover the page and are hard to close.
See our guides on mobile CRO and CRO and UX for more detail.
4. Sharpen Your Value Proposition and Calls to Action
Visitors decide within seconds whether a page is for them. Your headline should say what you offer, who it is for and why it is better. Then give one clear next step. Tips that tend to work:
- Write the headline around the visitor’s outcome, not your feature list.
- Use specific, action-focused button text such as “Get my free quote” instead of “Submit.”
- Give the primary button strong contrast and keep secondary actions visually quieter.
- Place the main call to action above the fold and repeat it after key sections.
Use heatmaps to confirm that visitors actually notice the button. For a full page-level review, follow our landing page checklist.
5. Simplify Forms and Checkout
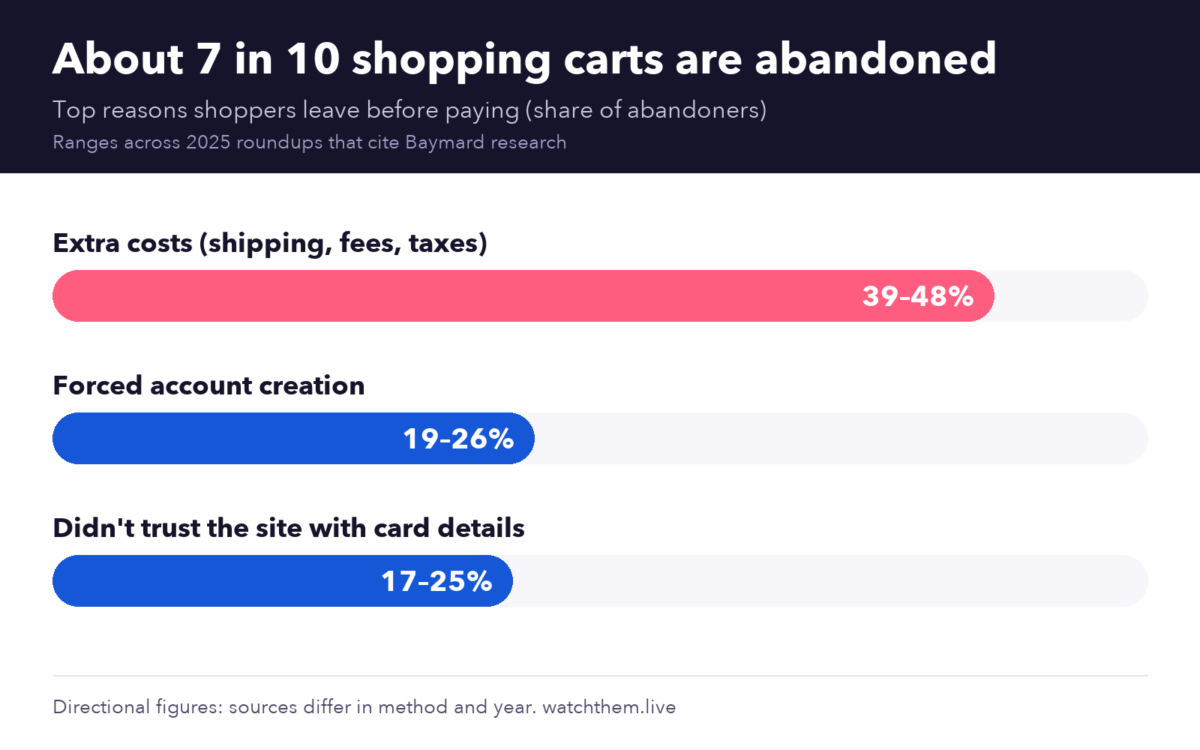
Checkout is where intent turns into revenue, and where much of it leaks. Research cited across 2025 roundups, mostly based on Baymard Institute studies, puts the average cart abandonment rate at about 70%. The most common reasons are unexpected extra costs (reported between roughly 39% and 48% of abandoners), forced account creation (roughly 19% to 26%) and a lack of trust in the site’s payment security (roughly 17% to 25%). The exact numbers differ by source, but the pattern is consistent.
What to do about it:
- Show total costs, including shipping and taxes, as early as possible.
- Offer guest checkout and let customers create an account after the purchase.
- Remove every form field you do not truly need.
- Show a progress indicator and allow customers to edit their cart without losing data.
- Offer several payment methods, including wallets.
Our article on checkout page design has layout examples, and recordings of abandoned sessions will show exactly which field causes the drop.
6. Add Reviews and Social Proof
People trust other customers more than they trust brands. A widely cited Spiegel Research Center study found that a product with five reviews was about 270% more likely to be purchased than one with none. The effect was strongest for higher-priced items, and the biggest gains came from the first few reviews. The same research found that purchase likelihood tends to peak at average ratings of about 4.0 to 4.7 stars, because perfect scores can look less believable.
Show ratings near the buy button, collect reviews with post-purchase emails, and add testimonials, case studies, logos and user counts where you have them. Always keep them real and recent. Consider asking customers for video testimonials for extra authenticity.
7. Show Trust Signals
Trust matters most when visitors are about to share payment details or personal data. Strengthen it with:
- HTTPS on every page and visible secure-payment badges at checkout.
- Clear shipping, return and refund policies, written in plain language.
- Real contact details and a live chat or support link.
- Privacy and compliance information, such as a GDPR statement.
Video can also help build trust and explain complex products quickly. Test a short product or explainer video on key pages, and measure whether it raises conversions for your audience rather than assuming it will.
8. Personalize the Journey
Visitors now expect relevance. A McKinsey survey published in 2021 found that about 71% of consumers expected personalized interactions and about 76% got frustrated when they did not receive them. The figure is dated, but the direction is clear. You can start simply:
- Show different headlines or offers for new and returning visitors.
- Tailor landing pages to the traffic source or ad campaign.
- Recommend products based on browsing behavior.
- Segment emails by actions, such as cart abandonment.
Learn more in our guide to CRO personalization and how customer-centric marketing supports it.
9. Test, Learn and Repeat
Every strategy above is a hypothesis until you test it. A/B testing compares two versions of a page to see which converts better. To get reliable results:
- Test one meaningful change at a time and write down your hypothesis first.
- Split traffic randomly and run the test for at least one to two full business cycles, for example two weeks, so weekday and weekend behavior are both covered.
- Wait for statistical significance, commonly a 95% confidence level, before declaring a winner.
- Document each result, including the losers, so you do not repeat mistakes.
If your traffic is too low for A/B testing, rely on qualitative research and before-and-after comparisons, and test bigger changes. If you need help from specialists, see our comparison of CRO agencies and our list of CRO tools.
Which Metrics Should You Track?
Track the numbers that connect directly to revenue, and review them weekly:
- Conversion rate overall and by device, source and landing page.
- Cart and checkout abandonment rate at each step of your funnel.
- Average order value and revenue per visitor.
- Page speed and error rates.
- Micro-conversions such as add-to-cart clicks, newsletter sign-ups and video plays.
Compare your results to a realistic benchmark with what is a good conversion rate and our key website UX metrics. If your rate is far below your industry, start with low conversion rate fixes.
Frequently Asked Questions About Conversion Rate Optimization Strategies
What is the best conversion rate optimization strategy?
There is no single best tactic. The strongest starting point is understanding real user behavior with analytics, recordings and heatmaps, then fixing the biggest friction points first, usually speed, mobile experience and checkout.
How long does CRO take to show results?
Quick fixes such as a broken button or slow page can lift conversions within days. A structured testing program usually needs three to six months to show a clear trend.
How much traffic do I need for A/B testing?
It depends on your current conversion rate and the size of the change you expect. As a rule of thumb, you need at least a few hundred conversions per variation. With less traffic, focus on research-led fixes and larger changes.
What is a good conversion rate?
Most e-commerce benchmarks fall around 2–3%, but it varies widely by industry, device and traffic source. Compare against your own history first and your industry second.
Can small businesses do CRO without an agency?
Yes. Many improvements, such as speeding up pages, simplifying forms and adding reviews, need no special team. Behavior-analytics tools make it easy to find problems yourself, and you can bring in a specialist later for advanced testing.
Conclusion
The most effective conversion rate optimization strategies share one habit: they start with evidence about what real visitors do, then test changes one at a time. Fix speed, mobile experience and checkout friction first, add social proof and trust signals, personalize where it makes sense, and keep a log of every test. Small, steady gains compound into a much better return on the traffic you already pay for.
