
Page Contents
Last updated: November 2026
A good conversion rate is usually between 2% and 5% for typical websites, but that range is only a rough starting point. Online shops often sit near 2% to 3%, paid search campaigns and focused landing pages can reach 7% or more, and some niches stay below 1% and still make a healthy profit. The right target depends on your goal, your traffic source, your device mix and your own history.
This guide answers the question the way the best-ranking resources do: it shows how to calculate the rate correctly, lists benchmark figures with their sources and limits, explains what makes a rate “good” for your own business, and ends with a practical way to set targets and raise them.
The Short Answer, in Four Lines
- Most websites: about 2% to 5% is the commonly quoted middle band.
- E-commerce: often around 2% to 3% overall, with large differences between product categories.
- Landing pages and paid search: higher, because visitors arrive with a specific intent and a single goal.
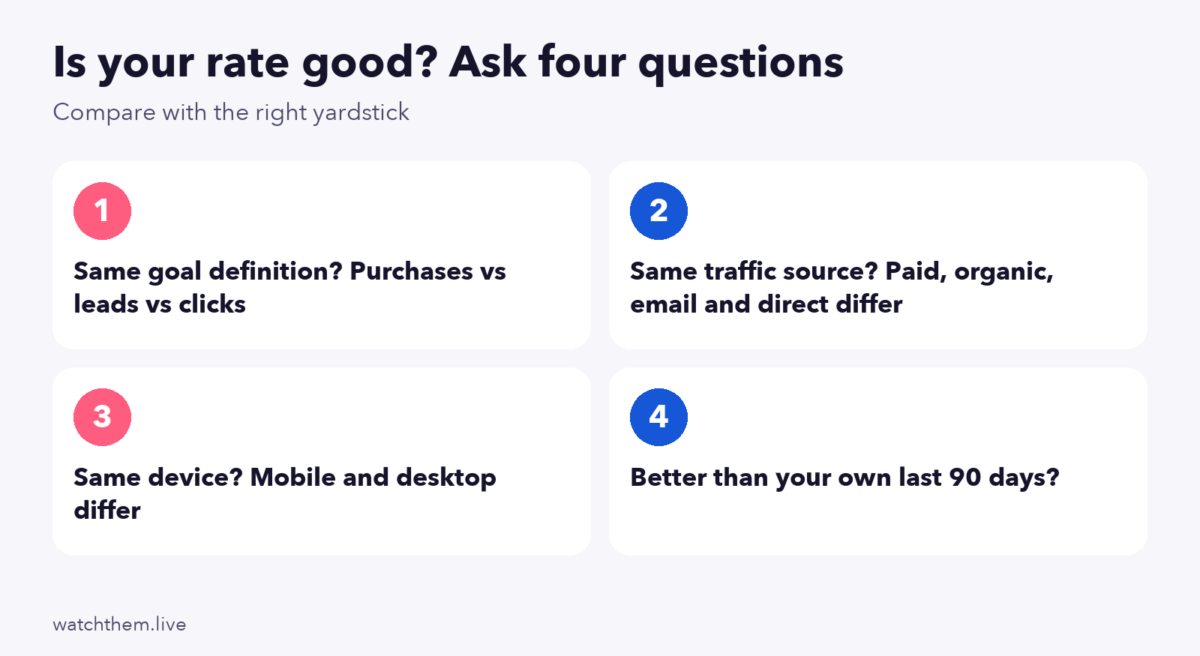
- Your own trend: a rate that beats your last 90 days under the same conditions is the benchmark that matters most.
How to Calculate Conversion Rate Correctly
The basic formula is simple: conversion rate = conversions ÷ visitors × 100. Ten orders from 500 sessions give a rate of 2%. The part that causes most confusion is the denominator, because the same campaign can show different rates depending on what you divide by.
| Denominator | Question it answers | Where you see it |
|---|---|---|
| Sessions | How many visits end in a conversion? | Session key event rate in GA4 |
| Users | How many people convert at least once? | User key event rate in GA4 |
| Ad clicks or interactions | How many paid clicks turn into conversions? | Conversion rate in ad platforms |
| Form starts | How many people who begin a form finish it? | Form completion rate |
| Qualified leads | How many leads become customers? | Lead-to-customer rate in a CRM |
Always write down which one you use. In GA4, conversions were renamed key events in 2024, so older guides that talk about “goal conversion rate” refer to the same idea under an old name. Sales cycles matter as well: if purchases take two weeks, a rate calculated on yesterday’s visitors will look artificially low.
What Counts as a Conversion?
A conversion is any action you decided is valuable. Macro conversions are the main goals: purchases, paid sign-ups, booked calls. Micro conversions are the steps on the way, such as adding to cart, starting a form or downloading a guide. A site that mixes them into one number gets a figure that looks good and means little, so keep a primary rate and report micro steps separately. The article on how conversion rate works and how to measure it covers the definitions in more detail.
Conversion Rate Benchmarks: What the Data Says
Benchmarks come from vendors, ad platforms and survey panels, each with its own sample and method, so treat every number below as a reference point, not a promise.
| Benchmark | Figure | What to remember |
|---|---|---|
| Landing pages, all industries (Unbounce 2024 report) | Median about 6.6% | Industry medians range from about 2.35% for e-commerce to about 12.3% for events |
| Search ads, Google and Microsoft (WordStream and LocaliQ, reported by Search Engine Journal) | About 7.52% for the 2025 report; about 8.18% in the 2026 report as summarized by secondary sites | Averages across many campaigns; methods change between years |
| E-commerce overall (Smart Insights, quoted by trade blogs) | About 2.5% in Q3 2025 | Other sources print 1.8% to 2.9%, depending on sample |
For landing pages the full report is on the Unbounce conversion benchmark report. The ad-platform figures come from secondary coverage, because the original pages were not reachable when this article was updated.
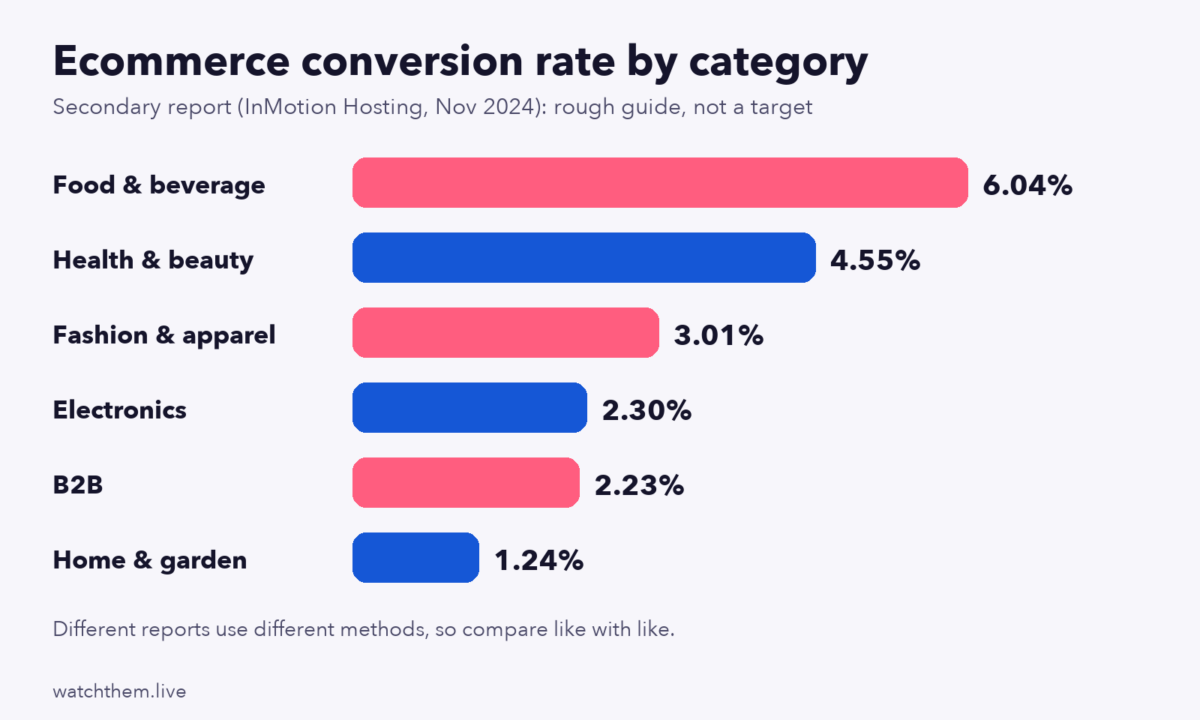
E-commerce Conversion Rate by Category
Shops are rarely comparable. Low-price repeat purchases convert far better than expensive, considered ones. A November 2024 roundup from a hosting company, itself a secondary source, listed food and beverage near 6%, health and beauty about 4.6%, fashion about 3%, electronics about 2.3% and home and garden about 1.2%. B2B e-commerce sat near 2.2%. The pattern is more useful than the exact decimals: the higher the price and the longer the research phase, the lower the rate.
Conversion Rate by Traffic Channel
Published channel averages disagree widely, so think in terms of intent instead of numbers.
- Paid search usually converts best among cold channels, because people type what they want right now.
- Email to subscribers converts well because the audience already knows you.
- Organic search varies by keyword: “buy” queries convert, research queries inform.
- Social media and display introduce you to people who were not looking, so rates are lower and lead to more micro conversions.
- Direct and referral traffic often includes existing customers and strong-intent visitors.
A blended site-wide rate hides these differences, so compare each channel with itself over time.
Is 1%, 2% or 10% a Good Conversion Rate?
Is a 1% conversion rate good?
It can be. For expensive products, long B2B journeys or cold social traffic it is common. If your margin per sale is large, 1% may be very profitable. If you sell low-priced items on high-intent traffic, 1% is a warning sign.
Is a 2% conversion rate good?
For most online shops it is near the middle of the pack, not a failure. The better question is whether it is rising and whether mobile and desktop are close.
Is a 10% conversion rate good?
It is excellent for a store, and normal for focused lead-generation pages or email offers. Check that the figure is not inflated by duplicate events, bots or a goal that is too easy, such as a page view.
Rate Versus Volume: Why a Higher Percentage Is Not Always Better
A high rate on little traffic produces few conversions. Always look at the rate and the count together, plus the revenue per visitor.
| Site | Visitors | Conversion rate | Orders | Average order value | Revenue |
|---|---|---|---|---|---|
| A | 2,000 | 5.0% | 100 | $30 | $3,000 |
| B | 20,000 | 2.0% | 400 | $30 | $12,000 |
| C | 20,000 | 1.5% | 300 | $60 | $18,000 |
The numbers are an invented example. Site A has the best rate and the lowest revenue, while Site C has the worst rate and the highest revenue. A “good” rate is one that supports your profit target.
Find Your Break-Even Conversion Rate
The most useful “good” number is the one below which a campaign loses money. For paid traffic the formula is: break-even conversion rate = cost per click ÷ profit per conversion. If a click costs $1.00 and each sale leaves $40 of profit after product and delivery costs, you need at least 2.5% to break even ($1.00 ÷ $40). A rate of 4% on the same traffic gives a healthy margin, while 1.5% loses money no matter what an industry average says.
| Cost per click | Profit per sale | Break-even rate | Reading |
|---|---|---|---|
| $0.50 | $25 | 2.0% | Easy to beat on a decent page |
| $1.00 | $40 | 2.5% | Near the typical e-commerce middle |
| $3.00 | $40 | 7.5% | Needs a very focused page or a better offer |
| $5.00 | $200 | 2.5% | Fine for high-margin products |
The figures are examples, not benchmarks. Use your own click costs and margins.
Conversion Rates for Lead Generation and B2B
When the goal is a lead, the rate depends on how much you ask for. A newsletter box converts far better than a form that asks for a phone number and budget. Treat the funnel as a chain of smaller rates instead of one figure: visitor to lead, lead to qualified lead, qualified lead to opportunity and opportunity to customer. Each link has its own healthy range, set by your sales process and average deal size, so measure the chain for your business and look for the weakest link. A strong visitor-to-lead rate with a weak lead-to-customer rate points to poor lead quality, not poor page design.
Seasonality, Promotions and Timing
Rates move through the year. Holiday weeks, sales events, payday cycles and back-to-school periods lift or lower conversions, so compare the same period with the same period a year earlier, not just last month with this month. Promotions raise the rate and may also lower margin, which makes the break-even view above more reliable than the rate alone. When you launch a test during a promotion, remember that results may not hold at normal prices.
What Affects Your Conversion Rate the Most
- Traffic quality and intent. The right people on the right page matter more than any design tweak.
- Offer and price. A weak offer cannot be rescued by a better button.
- Speed. Google’s “good” thresholds are an LCP of 2.5 seconds or less, an INP of 200 milliseconds or less and a CLS of 0.1 or less, measured at the 75th percentile (see the web.dev explanation of Core Web Vitals thresholds).
- Mobile experience. Phones carry most visits but usually convert lower, so mobile friction shows up in the total. See mobile conversion rate optimization tips.
- Trust. Reviews, policies, clear costs and visible contact details reduce hesitation.
- Friction. Long forms, forced accounts and surprise fees cost conversions at the last step. See checkout page design that reduces abandonment.
How to Set Your Own Conversion Rate Target
- Fix the definition. Pick the conversion, the denominator and the time window, then keep them constant.
- Clean the data. Remove internal traffic, check that each event fires once and match totals with your store or CRM.
- Segment the baseline. Record rates by device, channel, new versus returning visitors and top landing pages.
- Compare with a relevant benchmark. Use a source from your industry and traffic type, not a global average.
- Set a realistic step. A relative gain of 10% to 20% in a quarter is more believable than doubling. A move from 2.0% to 2.3% is a 15% relative lift.
- Tie the target to money. Convert the target into extra orders or leads and check that it justifies the work.
How to Improve a Conversion Rate You Think Is Too Low
Start with data, not a redesign
Run a structured review before changing anything. The steps are laid out in the CRO audit process and checklist.
Fix the pages with the most traffic first
A small gain on a page with 50,000 visits beats a large gain on a page with 500. Sort landing pages by sessions and by revenue.
Look for the biggest leaks in the funnel
Find where most people leave and why. Use funnel analysis to find drop-off steps and watch session recordings of real visitors at those steps.
Segment before you optimize
A mobile checkout problem needs a different fix from a weak desktop landing page. Splitting results by device and source avoids solving the wrong problem.
Test, do not guess
Turn each finding into a hypothesis and run an A/B test. A lift is only real if the test ran long enough and the variants were measured fairly.
Common Mistakes When Judging a Conversion Rate
- Comparing with a global average when your industry, price and traffic differ.
- Counting duplicate events. Page reloads on a thank-you page can double-count purchases and make a rate look better than it is.
- Mixing goals. Adding newsletter sign-ups and purchases into one figure hides what matters.
- Ignoring bots and spam traffic, which lower the rate without any real problem on the page.
- Judging on too little data. Weekly swings are normal at low volume.
- Chasing the rate and ignoring revenue per visitor.


Frequently Asked Questions About a Good Conversion Rate
What is a good conversion rate for a website?
About 2% to 5% is the common range, but the best yardstick is your own past results under the same conditions.
What is a good conversion rate for e-commerce?
Many shops land around 2% to 3%, with food and beauty higher and big-ticket items lower.
What is a good conversion rate for Google Ads?
Secondary reports of WordStream data put the average for search ads between roughly 7.5% and 8.2% in recent years, but campaign type, industry and budget change this a lot.
What is a good conversion rate for a landing page?
Unbounce reported a median near 6.6% across industries in 2024, with industry medians from about 2.35% to about 12.3%.
Why is my conversion rate lower on mobile?
Smaller screens, typing on a keyboard and interrupted sessions all add effort. Mobile checkout friction is a frequent cause.
How long should I wait before judging a change?
Run a test for at least one to two full business cycles and until it reaches the sample size you planned, not just until the result looks good.
Conclusion
There is no universal good conversion rate. A figure between 2% and 5% is a fair general guide, but a good rate for you is one you measured correctly, compare with a relevant benchmark and can improve step by step. Define the conversion, clean the data, segment by channel and device and set a realistic target tied to revenue. Then improve the pages with the most traffic first, backed by funnel analysis, recordings and tests.
