
Page Contents
Last updated: November 2026
A low conversion rate rarely has one cause. It is a symptom, and the same number can come from a broken tracking tag, the wrong visitors or a page that fails to persuade. Fixing the wrong one wastes weeks. This guide is organized as a diagnosis: first confirm that the rate is really low, then sort the problem into one of three types, then apply the fixes that belong to that type.
First, Is Your Conversion Rate Really Low?
“Low” only means something against a yardstick. Before you change a single page, check three things.
- Compared with what? A rate of 1% is poor for a low-price shop with search traffic and normal for a high-priced B2B service. Use your own history first, then a benchmark from your industry. If you need reference numbers, see our guide to what counts as a good conversion rate by industry and channel.
- Measured how? Confirm whether you divide by sessions, users or ad clicks, and keep it the same over time.
- Is the data correct? Duplicate purchase events, missing events after a site update, bot traffic and internal visits can all make a healthy site look broken, or a broken one look healthy.
If the rate fell suddenly, suspect tracking, a release or a campaign change before you suspect customer behavior. A slow decline over months points more to traffic mix, competition or page decay.
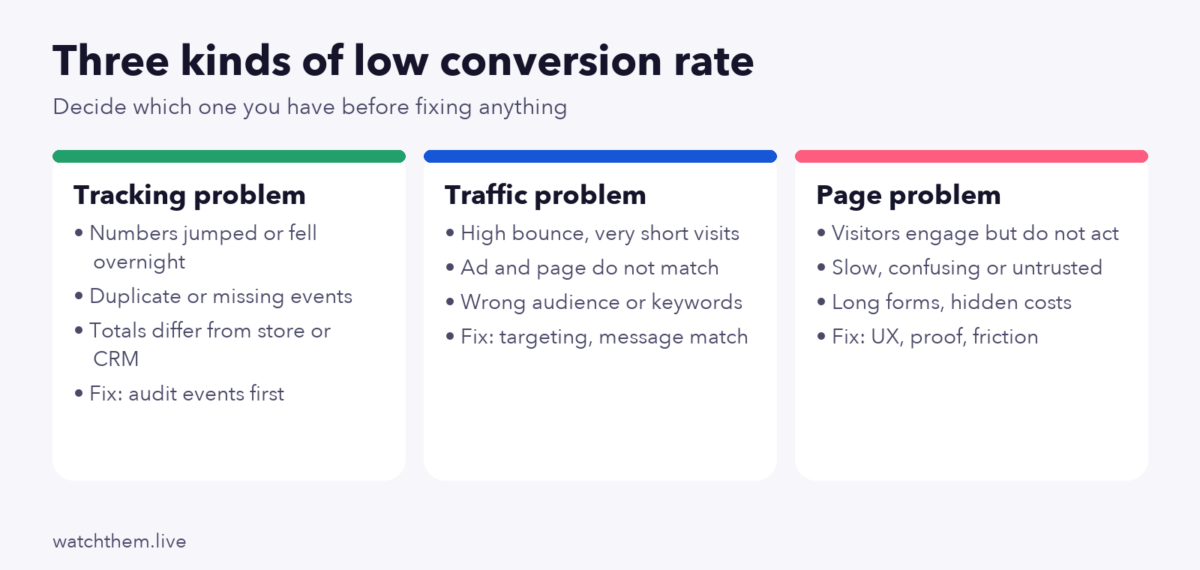
The Three Kinds of Low Conversion Rate
Sorting your case into one of these groups is the fastest way to save time.
| Type | Typical signs | First check |
|---|---|---|
| Tracking problem | Rate jumped or collapsed overnight; totals differ from the store or CRM; one device shows zero | Event debug view, order reconciliation |
| Traffic problem | Very short visits, high bounce from one source, ad promise differs from page | Conversion and engagement by source and campaign |
| Page problem | People read, scroll and click, then stop before the goal | Funnel drop-offs, recordings, surveys |
Symptom to Cause: A Diagnostic Table
| What you see | Likely cause | How to confirm |
|---|---|---|
| Traffic is up but orders are flat | New low-intent traffic source | Compare conversion by source and landing page |
| Visitors leave within seconds | Message mismatch or slow page | Engagement time, ad copy versus headline, load speed |
| Add-to-cart is fine, checkout is not | Surprise costs, forced account, weak payment options | Checkout funnel, recordings of the payment step |
| Mobile rate far below desktop | Small targets, long forms, hard card entry | Funnel split by device, real-phone test |
| Many form starts, few submits | Too many fields or unclear errors | Field-level abandonment, recordings |
| High traffic, low clicks on the main button | Weak call to action or hidden button | Click map, scroll map |
| Good rate on returning visitors, poor on new ones | Not enough trust or clarity for first-timers | New versus returning segment, on-page survey |
Cause Group 1: Tracking Problems
Check these before you accept that conversions really dropped.
- Duplicate or missing key events. A purchase tag that fires on page reload inflates the rate; a tag removed in a release deflates it.
- Different definitions between tools. The store, analytics and ad platform often count conversions differently because of attribution windows and consent settings.
- Consent banners. If a new banner blocks analytics until users accept, recorded visits can fall unevenly across devices and regions.
- Bots and spam. Non-human traffic raises visits but not orders.
In GA4 an engaged session lasts longer than 10 seconds, includes a key event or has two or more page or screen views, and bounce rate is 100% minus the engagement rate. Compare those figures by source: if one source has almost no engaged sessions, you have found a traffic problem, not a design problem.
Cause Group 2: Traffic Problems
Wrong audience for the offer
Broad keywords, loose audience targeting and clickbait headlines bring visits that never intended to buy. Look at the search terms, placements and audiences behind the worst-converting campaigns, then narrow or exclude them.
Message mismatch
If the ad promises a discount and the landing page opens with a generic brand headline, people assume they landed in the wrong place. Repeat the promise, the offer and the visual cue from the ad on the landing page.
Intent mismatch
Informational visitors landing on a hard-sell page leave, and buying visitors landing on a long article leave too. Match page type to search intent.
Mixed sources in one average
A site-wide rate blends strong email traffic with weak social traffic. Report each source separately before judging the page.
Cause Group 3: Page Problems
An unclear value proposition
If a first-time visitor cannot say what you offer and why it is better after five seconds, they leave. Put the benefit, who it is for and the main action in the first screen.
Slow or unstable pages
Google’s “good” Core Web Vitals thresholds are a Largest Contentful Paint of 2.5 seconds or less, an Interaction to Next Paint of 200 milliseconds or less and a Cumulative Layout Shift of 0.1 or less at the 75th percentile (see the web.dev Core Web Vitals thresholds). Compress images, defer unneeded scripts and reserve space for late-loading elements.
Confusing next step
One page, one main action. Several competing buttons make people hesitate. Use specific button text, strong contrast and enough empty space around the action.
Too much friction
Every extra field, forced registration or unexpected fee costs conversions. Baymard’s checkout research found that the average checkout showed about 11.3 form fields in 2024, which leaves room for trimming, and in 2025 it found roughly 6% of shoppers abandoned when their preferred payment method was missing (see the Baymard checkout benchmark).
Missing trust
Reviews, clear policies, visible contact details, secure payment cues and honest delivery times answer the silent question “can I rely on this?”. Place them next to the decision, such as beside the pay button.
A generic experience
The same page for a returning customer and a first-time visitor often fits neither. Simple personalization, such as showing a reorder shortcut, can help. See personalization strategies for CRO for safe first steps.
Unanswered questions
Shipping costs, returns, setup time, cancellation and support are the usual hidden objections. Answer them on the page, using questions pulled from support tickets and chat logs.
Poor mobile experience
Because most visits come from phones, a weak mobile page drags down the total. Review mobile conversion rate optimization tips for speed, tap targets and forms.
Typical Causes by Business Type
| Business | What is usually behind a low rate | Where to look first |
|---|---|---|
| Online shop | Surprise shipping costs, forced accounts, weak product pages, poor mobile checkout | Cart and checkout funnel by device |
| Software with a free trial | Unclear value in the first screen, long sign-up form, slow onboarding | Sign-up funnel and first-session recordings |
| Lead generation and services | Long forms, vague offer, slow follow-up, little proof | Form abandonment and response time |
| Content and affiliate sites | Weak intent match, buried links, too many ads | Click maps on the main call to action |
| Bookings and local services | Hard-to-find phone button, no availability, unclear prices | Mobile tap events and call clicks |
A Worked Diagnosis Example
Imagine a small shop whose rate fell from 2.4% to 1.6% over six weeks. A tracking review found no duplicate or missing events and totals matched the store, so the drop was real. Splitting by source showed email and direct traffic unchanged while paid social had doubled in volume and converted at under 0.5%. The overall rate fell because the mix changed, not because the site got worse. Within paid social, one new audience brought almost all the weak visits, and the ad promised “free delivery” while the page showed a delivery fee at checkout. The fix was to narrow the audience and match the ad to the real offer. This example is invented, but the order of questions is the point: tracking, then segments, then the step with the largest loss.
Questions to Ask Visitors and Customers
Short surveys turn guesses into evidence. Use a few open questions on exit or after purchase.
- What almost stopped you from buying today?
- What were you looking for that you could not find?
- What would make this page more useful?
- Where did you hear about us, and what did you expect to see?
- What question did you still have before leaving?
Group the answers into themes and count them. A theme that appears again and again, such as delivery cost or missing sizes, is a stronger signal than any single comment.
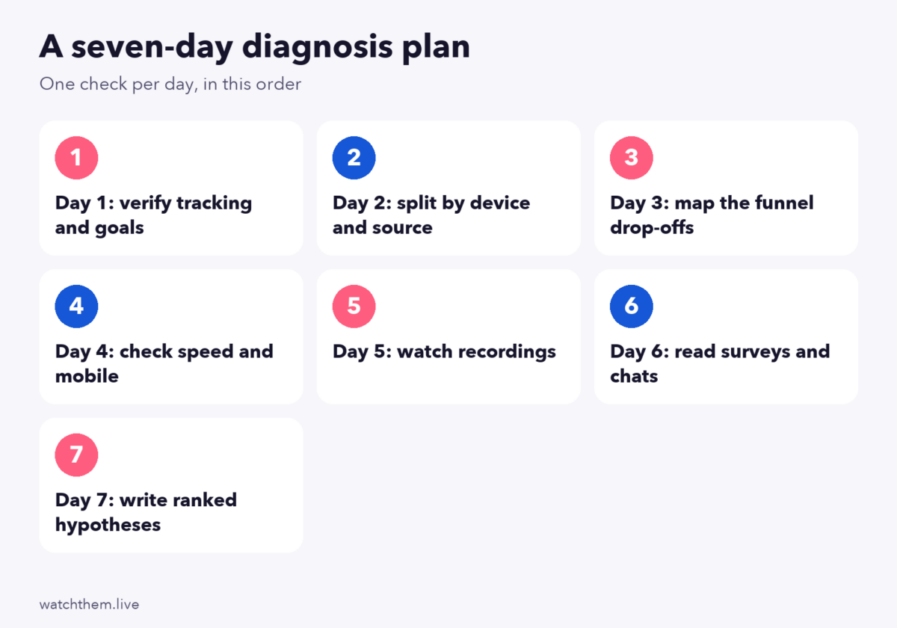
How to Find the Real Cause: A Seven-Day Plan
- Day 1, tracking. Verify that every key event fires once and totals match your store or CRM.
- Day 2, segments. Split the rate by device, source, campaign and new versus returning visitors.
- Day 3, funnel. Map the steps and find the biggest absolute loss. Use funnel analysis to find drop-off steps.
- Day 4, speed and mobile. Check field data for LCP, INP and CLS on top landing pages and test on a real phone.
- Day 5, behavior. Watch session recordings of real visitors at the weakest step.
- Day 6, voice of customer. Read survey answers, support tickets and chat transcripts for repeated doubts.
- Day 7, hypotheses. Write each finding as “If we change X, then Y, because Z” and rank by impact, confidence and effort.
For the full method with a checklist, see the CRO audit process and checklist.
Quick Fixes That Often Pay Off
- Match the headline to the ad or search query.
- Remove optional form fields and enable autofill.
- Show total cost, delivery time and return policy early.
- Offer guest checkout and common wallets.
- Move proof, such as reviews, next to the main button.
- Compress hero images and delay non-essential scripts.
- Rewrite vague button text such as “Submit” into the outcome the visitor gets.
Treat these as hypotheses and test them, because a fix that helps one audience can hurt another.
When a Low Rate Is Not a Problem
- Top-of-funnel traffic. Blog and social visitors are not ready to buy, so measure micro conversions such as sign-ups or product views.
- High-price or long-cycle products. Low rates are normal when customers compare for weeks.
- High margin. A 0.8% rate can be profitable when each sale is large.
- Rapid growth in new traffic. A broad campaign can lower the percentage while raising total orders.
Always judge the rate with volume, revenue per visitor and cost per acquisition.


Frequently Asked Questions About a Low Conversion Rate
What is considered a low conversion rate?
There is no fixed line. Rates below about 1% are common for expensive or cold-traffic offers and weak for cheap, high-intent ones, so compare with your industry and your own history.
Why did my conversion rate suddenly drop?
Check tracking first, then recent releases, campaign changes, site speed and payment or checkout errors. Sudden drops usually have a technical or campaign cause.
Why is my traffic high but sales low?
The traffic may be low-intent, the ad may not match the page or the page may have friction. Compare conversion and engagement by source.
How long does it take to improve a conversion rate?
Quick fixes can move numbers within weeks, but reliable tests take one to two business cycles each, so a structured program takes months.
Should I redesign my site to fix a low conversion rate?
Rarely as a first step. A redesign without diagnosis can repeat old problems. Fix the evidence-based issues first.
Which tools help diagnose a low conversion rate?
Analytics for segments and funnels, recordings and heatmaps for behavior, surveys for reasons, and an A/B testing tool to verify fixes.
Conclusion
Treat a low conversion rate as a symptom. Confirm the number is real and measured the same way, sort the problem into tracking, traffic or page, and use the table of symptoms to pick the right check. Fix the biggest leak first, test every change, and judge results by revenue as well as percentage. A week of focused diagnosis usually teaches more than months of random tweaks.
