Page Contents
Wouldn’t it be great if you could grow your business? Nowadays, people are able to easily find the products they are looking for on an eCommerce website. Ecommerce websites highly impact the conversion rate of many businesses, especially during the COVID 19 pandemic. Many people who preferred to stay at home, shift to online shopping, and as a result, some industries like food and grocery delivery have been growing. Several successful businesses continue to thrive in this atmosphere because of focusing on their conversion rate. If you want to reach for success in this field as well and improve your eCommerce conversion rate, you should know eCommerce conversion rate benchmarks which we delve into in this article.
Note: Do you want more and more users to complete your desired action and increase your conversion rate? WatchThemLive is a behavior analytics tool that enables you to identify your website’s drop-off points; so you can quickly fix them. Stay tuned!
What Is eCommerce Conversion Rate?
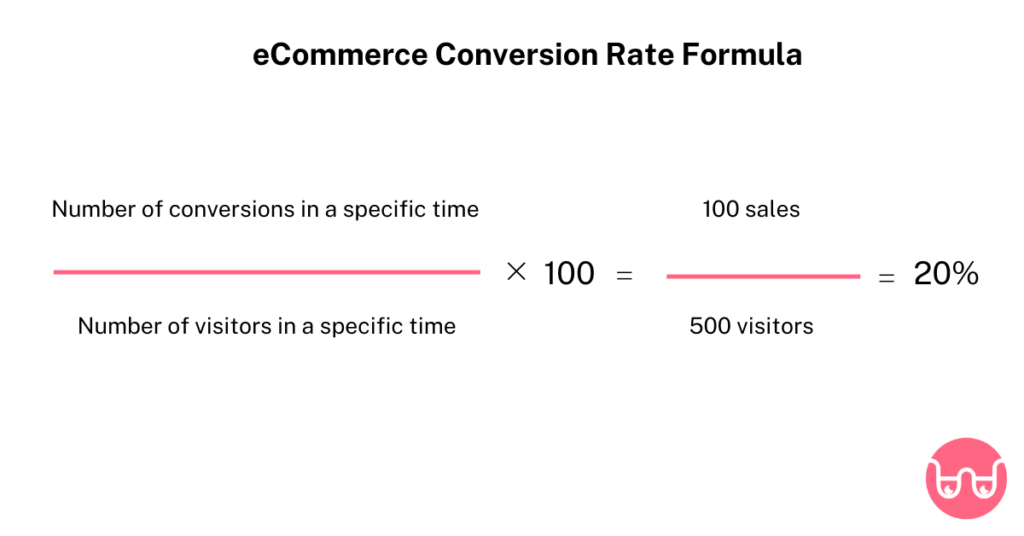
Conversion rate refers to the number of visitors who completed the desired action you wanted them to take in your eCommerce conversion funnel. So if you divide the number of conversions by the total number of visitors, you can calculate your conversion rate.


According to the picture above, if your eCommerce site receives 500 visitors in a month and you make 100 sales, to calculate your conversion rate you should divide 100 by 500. So, your conversion rate is 20%.
Have you ever experienced doing your best to increase your eCommerce conversion rate but you weren’t successful for unknown reasons?
Don’t worry! We’re here for you.
We highly recommend one of the best eCommerce conversion rate optimization tools named WatchThemLive. This platform provides you with all the services you need such as session replay or heatmaps to improve your conversion rate.
- Session replay: As its name suggests, a session replay is a reproduction of your user’s journey as they are browsing your website. It allows you to see the world as customers do and understand them completely. All you need to do is to register on WatchThemLive to find out why customers leave your website empty-handed.
- Heatmaps: If you want to know how your customers are using your website, this feature is made for you! Heatmaps are the easiest way of data visualization by using warm and cold colors. The most popular areas on your website are indicated by warm colors and the less popular areas are indicated by cold colors. So you can easily recognize which areas on your website have received the most clicks.
Interested? Sign up for free and give WatchThemLive a try!
Having a good conversion rate is just one side of the story. What is important to site managers is to know the eCommerce conversion rate benchmarks in order to understand how their conversion rates compared to competitors. Here, we look at some free industry sources focusing on eCommerce conversion rates.
eCommerce Conversion Rate by Country
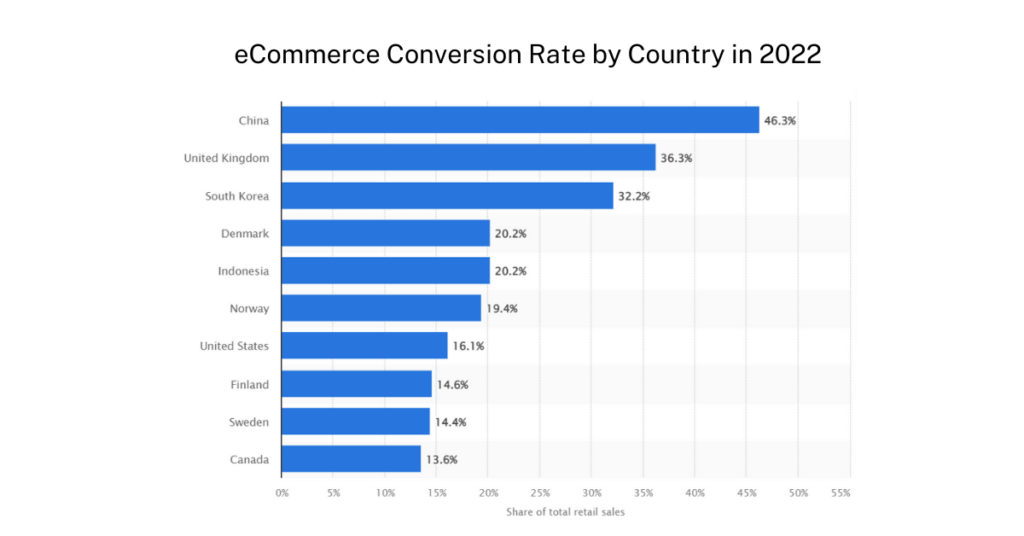
First, you need to pay attention to benchmark conversion rates of popular countries which have the highest percentage of retail sales. According to Statista, China has the most popular eCommerce market in 2022. So you shouldn’t expect the same conversion rates from different countries; this difference has originated from many factors such as purchasing power parity (or PPP), credit card penetration (or CCP), etc.


eCommerce Conversion Rate by Industry
Second, you can set your KPIs based on industry benchmarks. As Statista demonstrates, the graph below is based on “29 billion visits from 1 billion shoppers to 2276 digital commerce sites in 61 countries.” The eCommerce conversion rate of the food and beverage sector was high, 4.4%, in 2022. And the lowest conversion rate is related to online shopping sites for home furniture.
Many factors influence the average eCommerce conversion rate in different industries:
- Product cost
- Product value
- Device
- Traffic source
- Location
- Platform
According to the latest data, as of May 2022, the average conversion rate for eCommerce increased by 2.87% as compared to May 2021.
eCommerce Conversion Rate by Traffic Source/Channels
Third, you can segregate the conversions based on traffic sources besides the benchmarks above. According to the latest data on Statista which shows “130 million website sessions and over 330 million euro in online revenue over the 12 months from November 2018 to October 2019”, 65% of total eCommerce sessions come from search engine traffic during this period. Organic search engine traffic had a conversion rate of 33%, in contrast, paid search engine traffic had a conversion rate of 32%. The best performer was referral traffic which gets the maximum conversion rate followed by emails and social media.
Moreover, these traffic sources can work in line with industries. For example, email marketing can be very helpful in the case of the food and drink sector or social media channels can highly impact fashion, beauty & wellness, electronics, and food & drinks in order to drive high traffic.
eCommerce Conversion Rate by Device
Fourth, many people use different devices such as smartphones, tablets, and desktops when shopping online. Interestingly, conversion rate of large-screen devices such as desktops and laptops was higher than smartphones in 2021; they convert twice compared to smartphones (1.6%) because browsing a site is much easier on the large screen.
In 2022, smartphones have higher engagement rates than desktops and over a year, mobile users’ share has increased by over 10%. According to Merchant Savvy, 58% of all multi-device purchases use smartphones in 2022, while the conversion rate of desktops was about 3.7% in 2021.
What Is a Good Conversion Rate for eCommerce?
Although the eCommerce conversion rate of each industry performs differently, the latest studies in 2020 show that the average eCommerce conversion rate is around 2.5-3% and a 3%-plus conversion rate is a good eCommerce conversion rate that should be the baseline goal for your business.
Conclusion
In this article, we discussed four categories of eCommerce conversion rate benchmarks that you should consider. Now, the next step you need to take is your eCommerce conversion rate optimization because as Joey Logano said, THERE’S ALWAYS A ROOM FOR IMPROVEMENT. To increase eCommerce conversion rate, you need to test and optimize your site regularly because CONSISTENCY IN ACTION IS KEY TO SUCCESS. After all, a behavior analytics tool like WatchThemLive enables you to put your website under the microscope and boost your conversion rate. Sign up for FREE!

