Page Contents
UX analysis is a must-do in today’s world. User experience is one of the most critical components of customer experience (CX). You need to conduct detailed analytics on your UX to ensure that it is constantly working out optimally. Obviously, you cannot expect to have a fully-functional business that generates tons of revenue without analyzing your user experience.
Every business owner needs a comprehensive plan for aligning their company’s brand identity with the intended user experience at each customer touchpoint. A successful UX strategy helps with that. Is it enough, though? No! You will need detailed analysis alongside all of that.
UX analysis helps you figure out how your users see and experience your product. Then, you can proceed to fix the problems and optimize your strengths. This way, you can ensure an intuitive and painless user experience. But what is UX analysis exactly? Read this article to find out more.
What is UX analysis?


UX analysis is the process of gathering user experience data and analyzing it. The basis of this analysis is how your users interact with your product and how they experience it. You will then use that data to boost their experience.
Successful UX analysis of the website provides you with a sequence of measures to understand better what is desirable and frustrating for users. Afterward, your team can implement changes to see if conversion rate optimization happens or not. You can also track other customer experience metrics to evaluate UX.
In UX analysis, you are mostly concerned with two data types:
- Qualitative UX data, which are subjective user insights.
This type of data helps you figure out the issues your users run into.
- Quantitative UX data, which are numerical and measurable metrics.
This type of data helps you understand why and how these issues annoy your users.
Combining these two types of data gives you a complete picture of the UX. Quantitative data might say that users interact with specific elements but do not click your CTAs. After discovering the problem, qualitative data tells you why your users do not take the next step. Additionally, you can find out how you can persuade them to take action.
How do you collect data?
So, as we learned above, UX analysis is mainly conducted based on qualitative and quantitative data. Before anything else, you need to collect your data to apply website or app UX analysis methods. Then, go and track the website UX metrics you have in mind and analyze your UX. There are various ways you can go to collect each type of data. Here we will discuss the most efficient ones.
-
Qualitative UX data

Collecting qualitative data is an essential part of UX analysis. Subjective insight is the source of qualitative UX data. Direct VoC (voice of the customer) feedback, spoken/written user insights, and many more things reveal why customers behave a certain way. Consumer psychology can help you understand the underlying layers of those behaviors. Then, you can implement behavioral tracking to target them based on their behaviors.
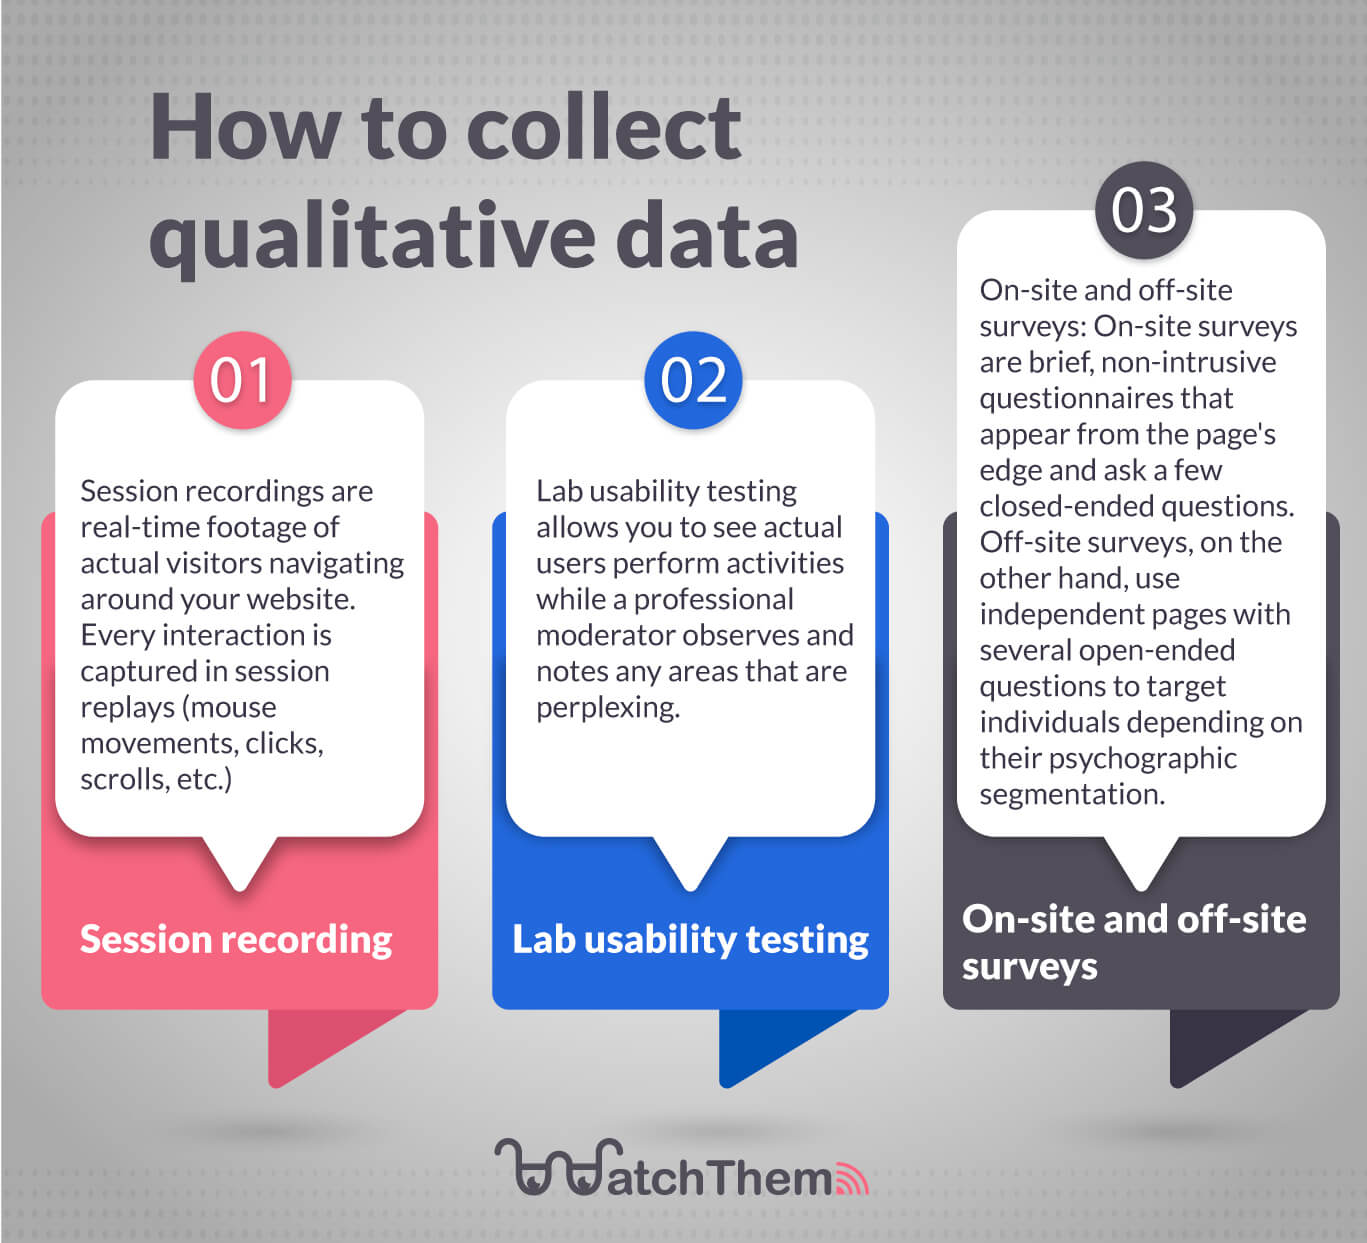
1. Session Recordings
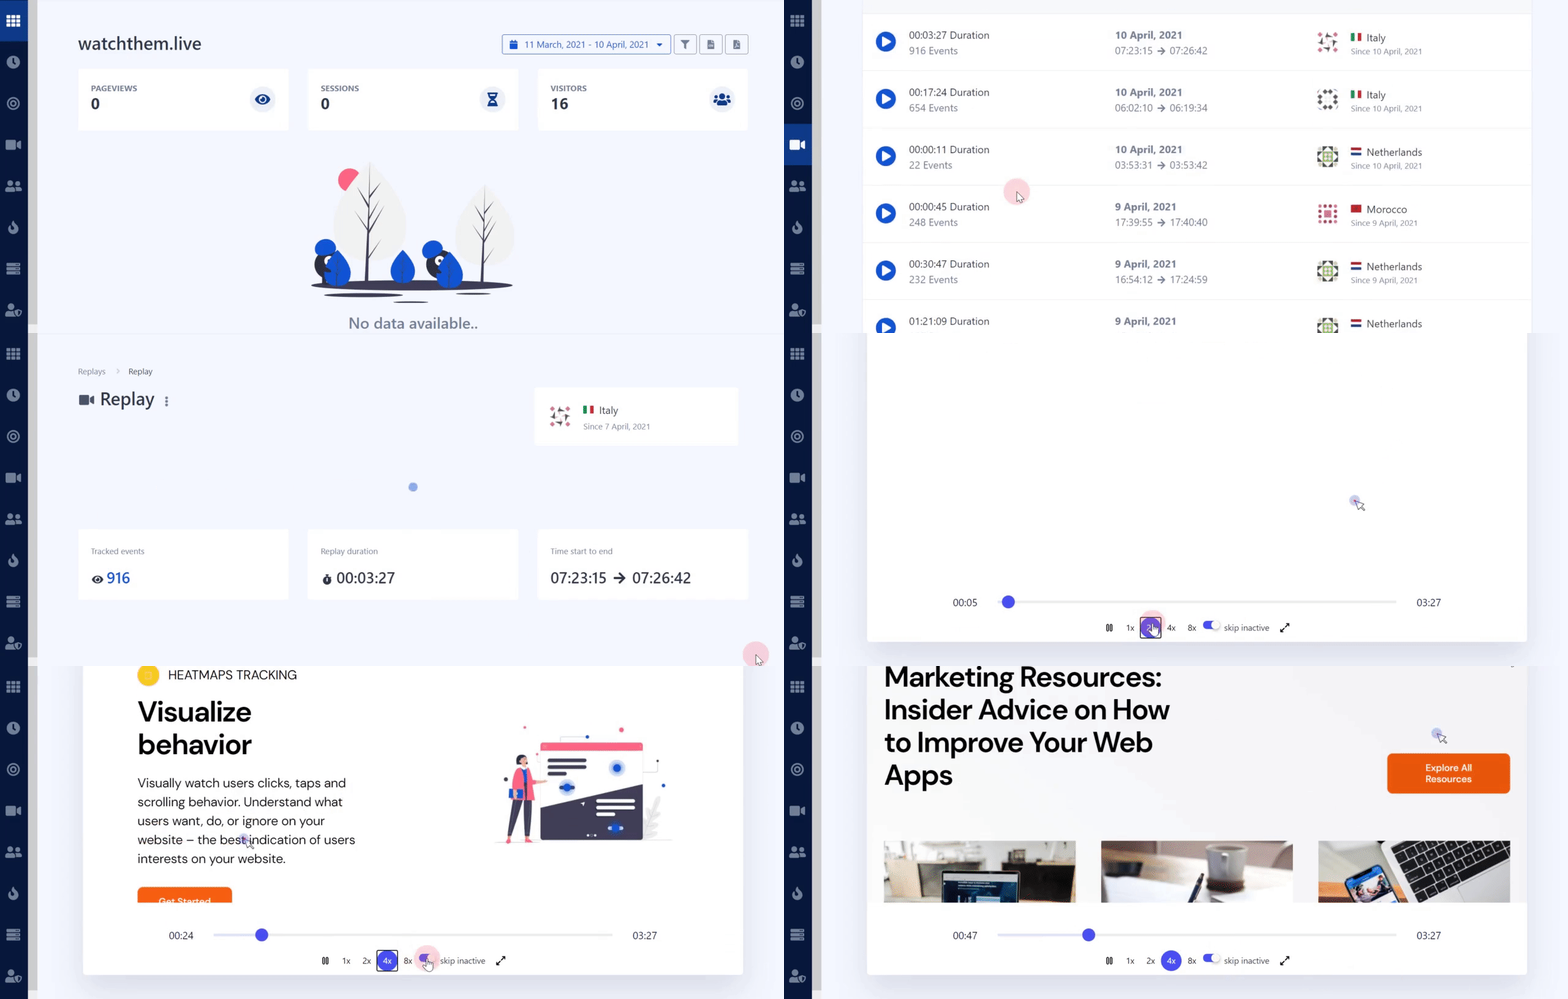
Session recordings are real-time videos of real users going through your website. They capture every interaction (mouse movements, clicks, scrolls, etc.). U-turns, stumbles, rage clicks, and exits are represented clearly in session recordings.


WatchThemLive has a fantastic session replay tool that offers you great services. You can boost your conversion rates simply by identifying and fixing the issues your users run into. You can also provide resourceful customer service. Additionally, WatchThemLive provides an excellent UX analysis framework for you to work with. Sign up for FREE and escalate your business like never before!
Analyzing session recordings will help you identify UX issues, functionality and accessibility blockers, and a lot more. Additionally, you can find out how to fix them.

2. Lab usability testing
Today, many usability testing methods can help you gather qualitative UX data. Usability testing lets you find out how user-friendly your product is.
Lab usability testing lets you watch real users complete tasks while a trained moderator monitors and notes confusing areas. You will also be able to find opportunities for optimization.
You must conduct lab usability tests under standardized conditions. Then, you can also compare product variations.
Finally, you can conduct user experience analysis based on the data you gain from the user behavior.
3. On-Site and off-Site surveys
Surveys are another way of performing UX analysis. On-site surveys are short, simple, nondisruptive questionnaires that pop up from the edge of the page. They usually contain a few close-ended questions. To gather feedback on particular elements, you can trigger surveys to appear only on some pages.
On the other hand, off-site surveys target people based on their psychographic segmentation or demographics on standalone pages. This way, you can ask numerous open-ended questions to learn about their experience.


-
Quantitative UX data

Much like qualitative data, gathering quantitative data plays a crucial role in UX analysis. Quantitative data is composed of numerical and measurable values. Metrics and customer satisfaction rankings can give you a resourceful vision of the issues your product faces.
1. Heatmaps
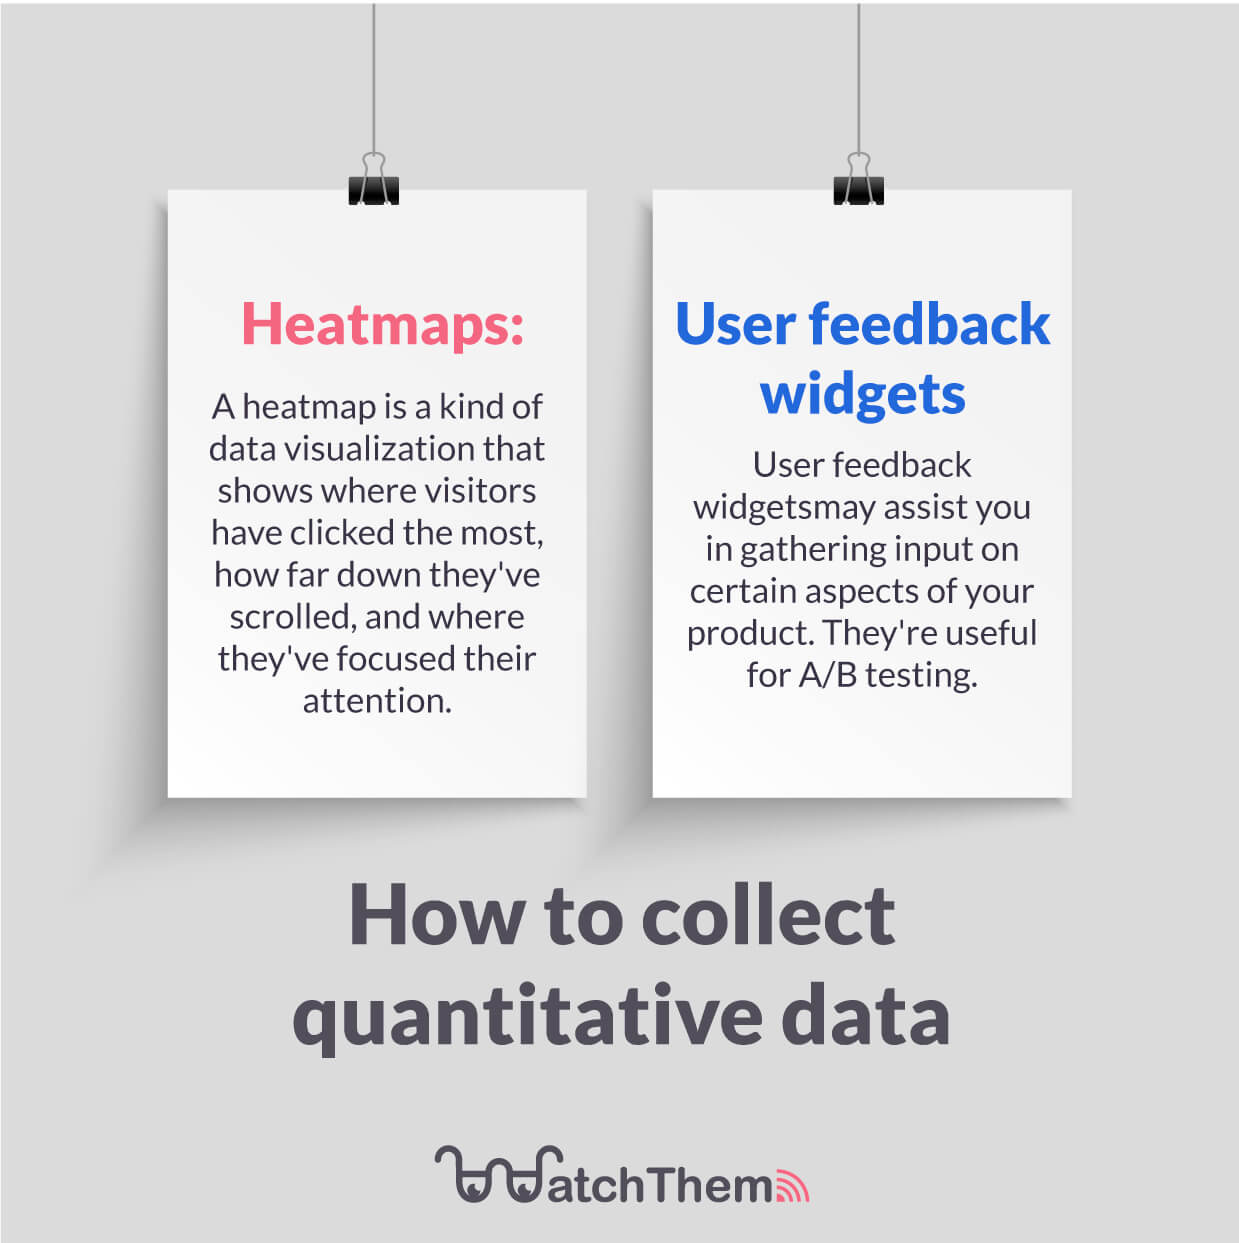
Heatmap is a method for data visualization. Heatmaps use different colors to visualize the data. They generate this data to represent what your users are doing on your website. This includes where they click and how far down they scroll.


WatchThemLive provides detailed heatmaps for you to enable you to discover what your users are doing. Get started with heatmaps for FREE and start using WatchThemLive to improve your CRO.
Heatmaps are an inevitable part of UX analysis. Analyzing heatmaps data can assist you in finding out what blocks your user flow. You will then be able to fix your problems and use your opportunities to provide users with a better UX.


2. User feedback widgets
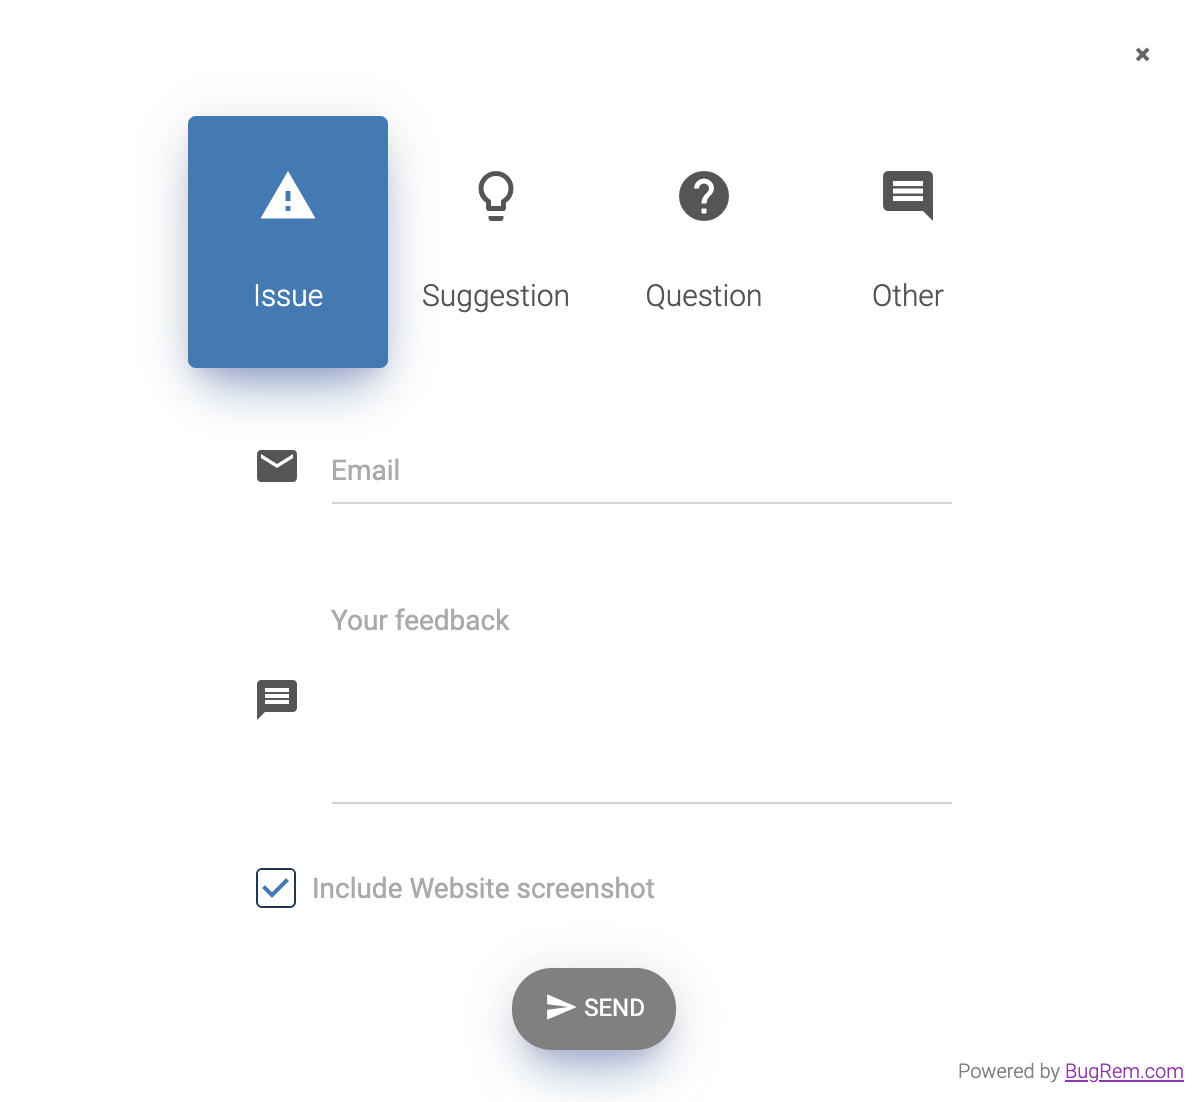
Feedback widgets can help you collect feedback on particular features of your product. They are beneficial in A/B testing. Data generated from feedback widgets can reveal elements that block the user flow or cause frustration for them.

How do you conduct a UX analysis?
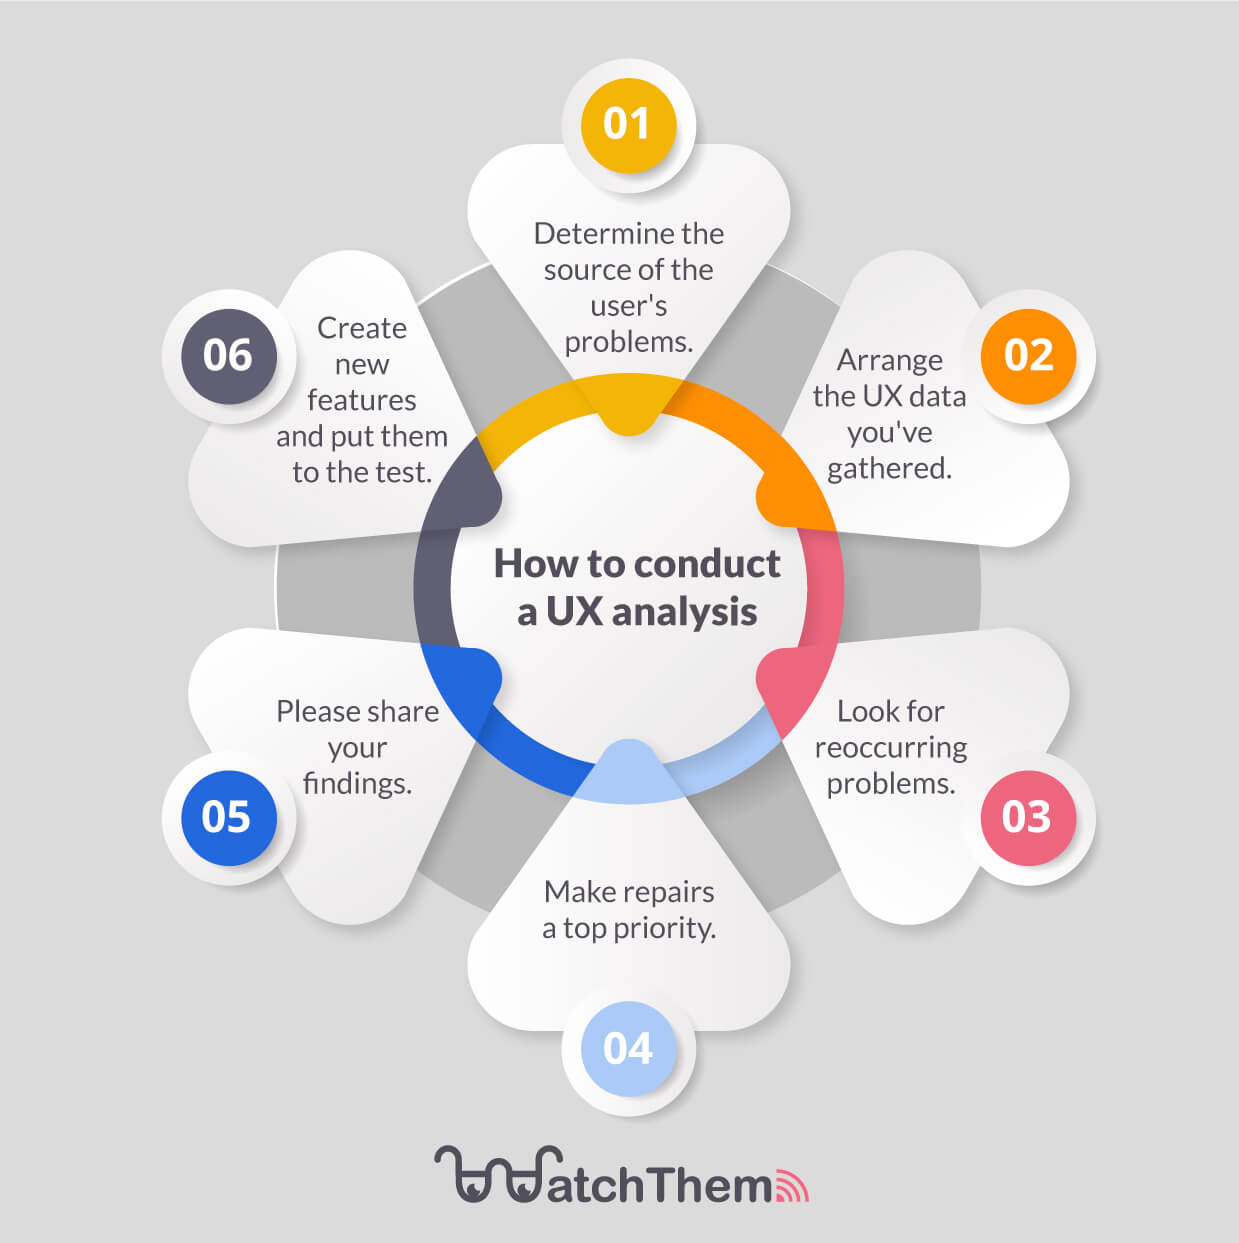

After collecting enough UX data via the methods above, it is high time you conduct your UX analysis. UX analytics comes down to organizing the generated data and searching for patterns and repetitive issues.
To conduct UX analysis, you need to follow the following procedure:
1. Figure out user issues.
At first, reviewing your UX data seems as if you have to look at thousands of pieces of data. However, qualitative data is here to help you identify common user issues. Some common issues include the inability to complete user onboarding, not knowing how to upgrade their pricing plans, and the difficulty of accessing a feature.
2. Arrange the collected UX data.
Arrange your UX data considering problems that your users ran into performing specific tasks. Getting frustrated and leaving a half-completed profile, inability to proceed through a payment, confusion when browsing through product pages are examples of this.
Find the issue, the actions users took, and the feedback they gave. Then, add categories and tags to be able to sort and filter the data.
Always remember to record your data in a sortable way. It is essential to be able to move it around, add notes to it, and share it with your team.
3. Check out recurring issues.
UX data and user feedback can drive you towards frequent issues users face. Analyzing session replays help you understand the reason for these issues.
Afterward, you should categorize and group them. Then, calculate how many users experience identical or similar problems. Finally, look for patterns and repetition to find out frequent issues.
4. Put fixes in priority.
You must make a decision about which UX metrics you want to put on your list of priorities. You have a list of issues, and you know what causes frustration in the user experience. categorization and prioritization of these fixes based on some criteria, such as critical, serious, and minor is important.
5. Share your results.
After evaluating and prioritizing your UX data, you should write a report and begin testing improvements. Then, you need to share what you found with your team. An excellent UX analysis report should highlight critical issues and be specific about their underlying layers. It also should include evidence and recommend solutions. Additionally, it is best if it includes positive results to update the team about what is working out fine.
6. Build and test new features.
To process UX feedback, you need to think, make, check, and repeat. Product teams must brainstorm to find potential areas of improvement. Then, product designers and developers should build new features to solve user problems. Eventually, product teams should test the new features and find out if users respond well. Fix everything that needs fixing, refine things that need refining, and repeat!
Conclusion
So, we learned that UX analysis is an essential part of every business. Also, we discussed that we need data to be able to conduct UX analysis. The most important and helpful data collection strategies were the ones we mentioned above. Finally, we provided you with a comprehensive UX analysis plan.
Voilà! Now you know how to conduct UX analysis to get the best results!

