Page Contents
Imagine you want to figure out what percentage of your users converted or completed at least one of your goal conversions to understand your website’s performance, how can you access this information? In this case, Google Analytics segments can help you filter data to focus on specific kinds of users to analyze and compare different segments. Google Analytics segments can be highly beneficial to businesses. Businesses can better understand their customer base and how they interact with the company’s website by creating specific segments. In addition, Google Analytics segments can help enterprises to improve their website design and content to attract more customers.
In this guide, you’ll discover what segments are, why you should use segments, and all possible questions about GA 3 and GA 4 in your mind.
Note: Although Google analytics segments divide your audience into smaller cohorts and give you quantitative insights about your visitors, they don’t help you visualize how people navigate through your website, scroll down a page, or what areas grab their attention. A behavior analytics tool like WachThemLive is ready to help you. Read on to see how!
What Are Google Analytics Segments?
Google Analytics segments are specific subsets within your data that help you break down it in different ways to analyze it more easily. You can create segments based on location, traffic source, or type of visitor. This allows you to see how other groups of people interact with your website and makes it easier to identify trends. For example, you might find that a particular audience segment is more likely to convert than others.
To better understand, consider segments in Google Analytics a temporary lens that you can apply to your Google Analytics reports. Imagine you may want to see how your website’s traffic changes from people who visit from desktop computers to those who visit from mobile devices. To do this, you can create a segment for “desktop” and another one for “mobile.”
You can also use segments to look at data for specific countries, browsers, or even days of the week. This can be useful for identifying trends and seeing where your website could use some improvement.
The next thing to you have to consider is deciding which Google Analytics Property you want to use. There are two types: Universal Analytics, which will stop processing data on July 1st, 2023, and then there’s the newest property called Google Analytics 4 (GA4). You can use segments in both properties, but they function differently depending on which kind of analytics product you’re using them for, so analytics teams and marketers need to know precisely where those options are located. All Google Analytics users will need to migrate to GA4 sometime shortly. For Google Analytics 4 properties, segments are only available in Explorations which is different than Universal Analytics.
Although segmentation in Google Analytics helps you find out more about your users, it can’t give you any information about users’ intent and expectations. Here WatchThemLive, one of the best Google Analytics alternatives, can take the stage. In this part, we’re going to explain how to use WatchThemLive’s features alongside Google Analytics segments.
- Heatmaps: Although Google Analytics heatmap shows you where users click on your web page, the problem is it no longer receives updates and has stopped working for some users. WatchThemLive’s website heatmap allows you to track user behavior on different devices (desktop, tablet, and mobile) and see what areas catch their attention the most. Website heatmap is a must for every digital marketer, UX designer, and eCommerce manager to:
- Improve CRO
- Enhance the Website’s usability
- Identify what satisfies users
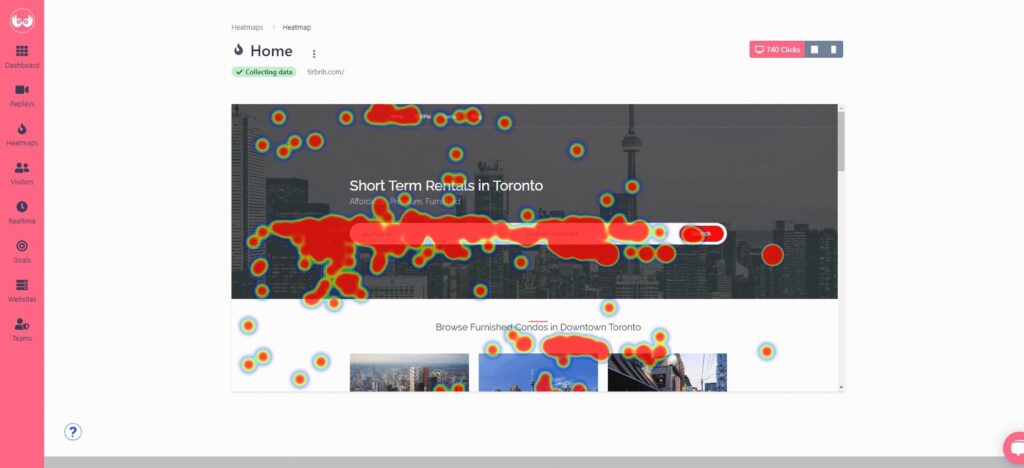

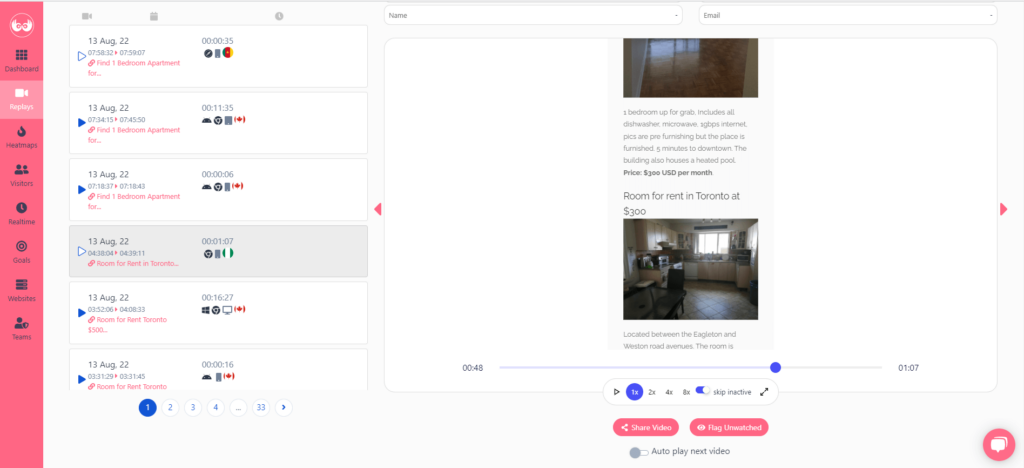
Session Recording: Google Analytics sessions just show you how much time users are spending on a specific page with few interactions. But you can’t understand whether users are engaging with your content or leaving your website after clicking on a broken video. You can use WatchThemLive’s session replay software to monitor the complete user journey in a session – from the moment they enter your website to the moment they leave – and analyze recordings by using advanced filters to see insights from specific country codes, devices, browsers, browser languages, screen resolutions, and operating systems.

Aside from these two features, it has other great features, and its pricing is also affordable. Their pricing package is different based on the services they provide. WatchThemLive’s premium plans start from $29 per month, and the most expensive plan is $99 per month.
So if you want to empathize with your users, you can use WatchThemLive besides Google Analytics data to discover more about users’ feelings and experiences, make sure to sign up!
What Are the Three Levels of Google Analytics Segments?
Before we continue, you need to understand different segment levels. There are three levels of Google Analytics segments:
1. Users: Users are people who interact with your website or app to initiate a session on your website and accomplish a goal.
2. Sessions: Sessions refer to a set of actions by a single person in a given time frame. They let you keep track of your interactions with a single user. And group all the things one person does on our site.
3. Hits: Hit refers to the number of interactions during a session, such as pageviews, events, and transactions.
You may be confused, but we’re here to make it clear. A single user in GA can have multiple sessions, and each session can have multiple hits.
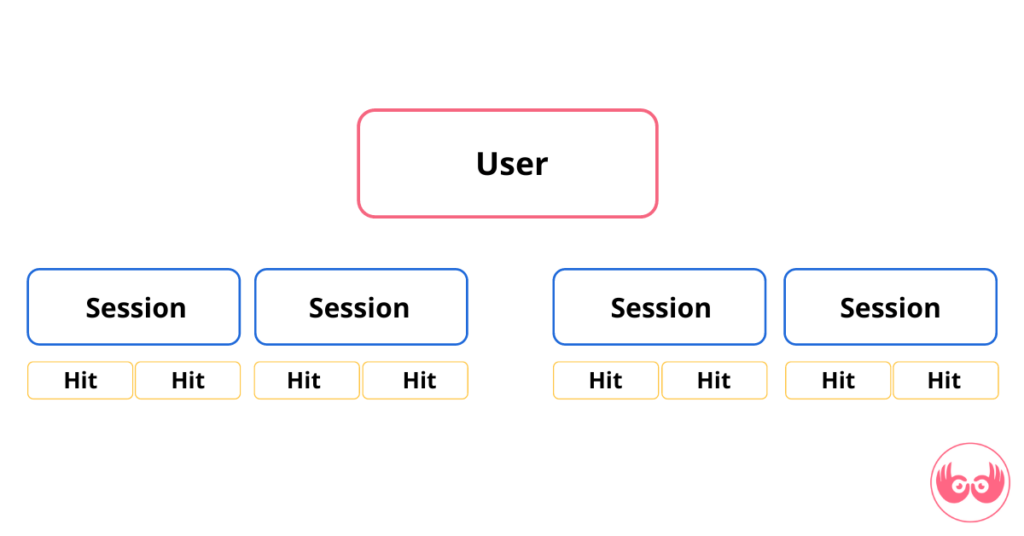

Let’s say you want to group all of the people who have spent more than $500 on your website. User A might have spent $250 during one session and $250 during another session, while User B spend $500 in just one session. In a user segment, both would be included. In a session segment, only User B would be included.
In Google Analytics 4 (GA4), the three levels of segments are:
– User Segments: These are subsets of users who visited your site or app—for example, people who have visited a specific product page but have not purchased the product.
– Event Segments: Event segments are the perfect way to segment your events and find out what’s going on in more detail. For example, all purchase events are made from a mobile device.
– Session Segments: are subsets of the sessions that have happened on your site or app. For example, all sessions arrived at your site through an email marketing campaign.
Also Read: What Remarketing Audiences Cannot Be Defined By Default?
How Do I Use Segmentation in Google Analytics?
Segmentation can be used in Google Analytics in a few different ways. Segments can allow you to focus your reports on specific traffic sections such as Google or Twitter or to focus on users who completed a specific goal, such as making a purchase.
For example, you might want to see which cities, states, or countries your users are visiting your site from. Or maybe you want to see the differences between mobile and desktop users. Segments allow you to break down your user data and give key insights to enhance your customer experience and generate incremental revenues.
To create a new segment, go to the “Segments” tab in Google Analytics and click the “+ New Segment” button at the top of any report page in Google Analytics. You’ll then be able to choose from a variety of criteria to include in your segment. You can choose system segments that are pre-created by Google Analytics, such as converters, made a purchase, and mobile traffic, or create your own custom segment.


If you want to create a custom segment, you’ll need to specify the criteria that define it. Then:
1. Click on the grey box “Add segment.”
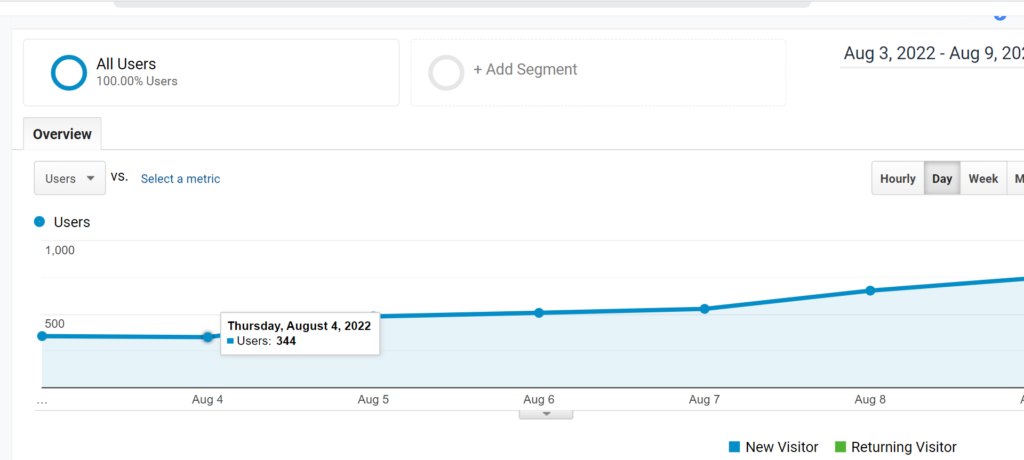

2. Click on “New segment.”
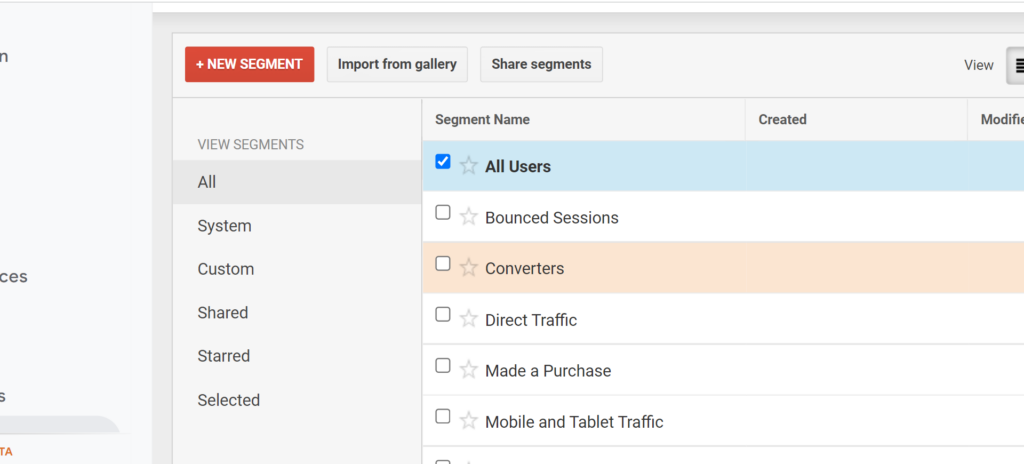

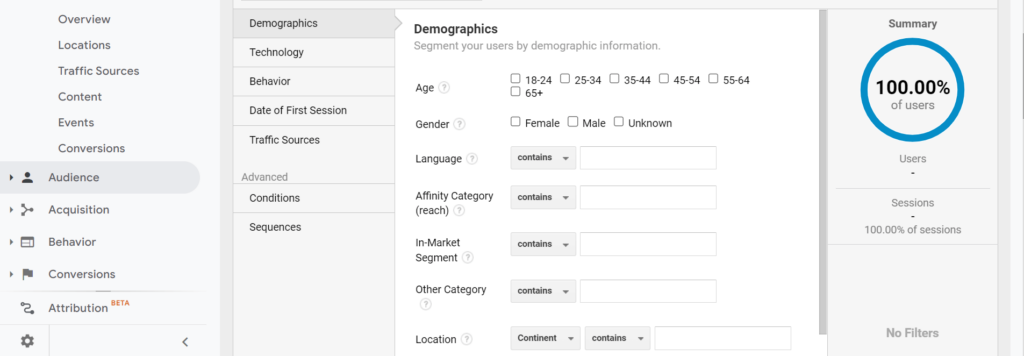
3. Determine the segment you want to choose:
- Demographics
- Technology
- Behavior
- Date of First Session
- Traffic Sources
- Advanced segment

4. After you’ve created your segments, it’s time to set up conditions. Conditions let Analytics know what data should be included or excluded from the segment by selecting specific values for comparison operators. You can choose conditions in advanced segments and define the criteria you want.
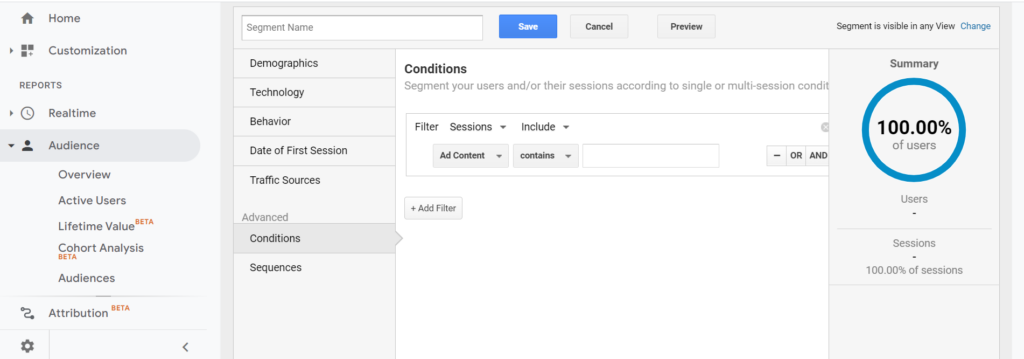

For example, you want to focus on specific groups of website visitors and analyze them based on the country they come from. If your business is located in Canada and most of your visitors come from there, you can create a segment to see data for Canadian audience members. And then compare the data to visitors from different countries.
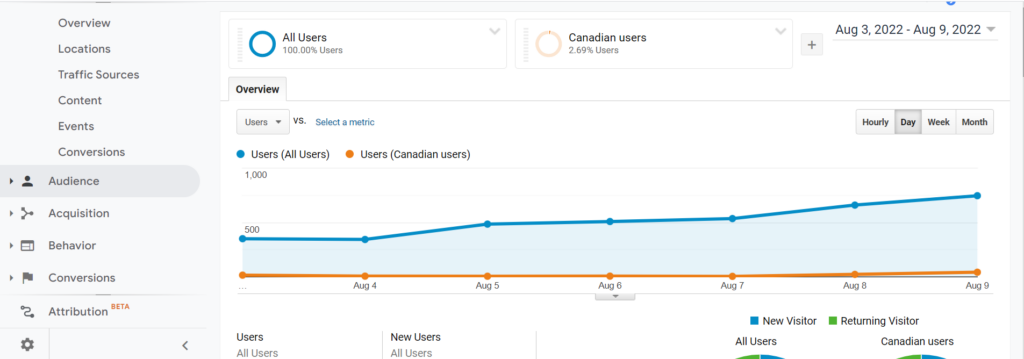

5. Remove the segment to add a new one.
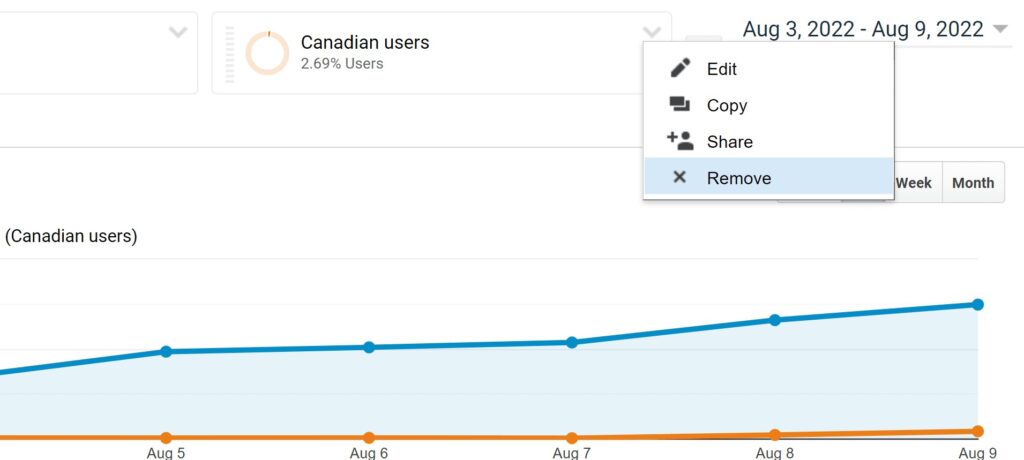

Once you’ve created your segment, you can apply it to any report in Google Analytics.
How Many Segments Can You Create in Google Analytics, and How Many Parts Does Google Analytics Allow You to Compare at Once?
In Universal Analytics:
• Users can create up to 1,000 segments that can be applied.
• 100 segments that can be applied.
Remember, you can compare up to 4 segments at a time.
In GA4:
• You can create up to 10 segments per exploration.
• You can simultaneously apply up to four segments to a particular exploration technique.
Conclusion
Google Analytics segments can be a highly beneficial way for businesses to understand their customer base and how they interact with the company website. Segments can be used in Google Analytics in several ways, such as creating reports or targeting ads.
Now, you know how Google Analytics segments help you investigate user behavior and website activity. Businesses can use Google Analytics segments to improve their website design and content to attract customers from specific groups, but there are some gaps that you can fill by using a behavior analytics tool like WatchThemLive. Sign up before it’s too late.
