

Page Contents

Last updated: November 2026
Goal conversion rate in Google Analytics was the percentage of sessions that completed a goal, and in Google Analytics 4 the same idea lives on as the key event rate. Universal Analytics goals stopped processing data in 2023, so anyone still searching for the “Goals” screen needs a translation. This guide explains the old metric, the GA4 replacement, the exact formulas, the setup steps and the checks that keep the number honest.
Old Goals vs GA4 Key Events: What Changed
In Universal Analytics, you created goals (destination, duration, pages per session or event) and the report showed a goal conversion rate. GA4 is event-based: every interaction is an event, and you mark the important ones as key events. Google renamed what GA4 used to call “conversions” to key events, and the related rate metrics are now called session key event rate and user key event rate.
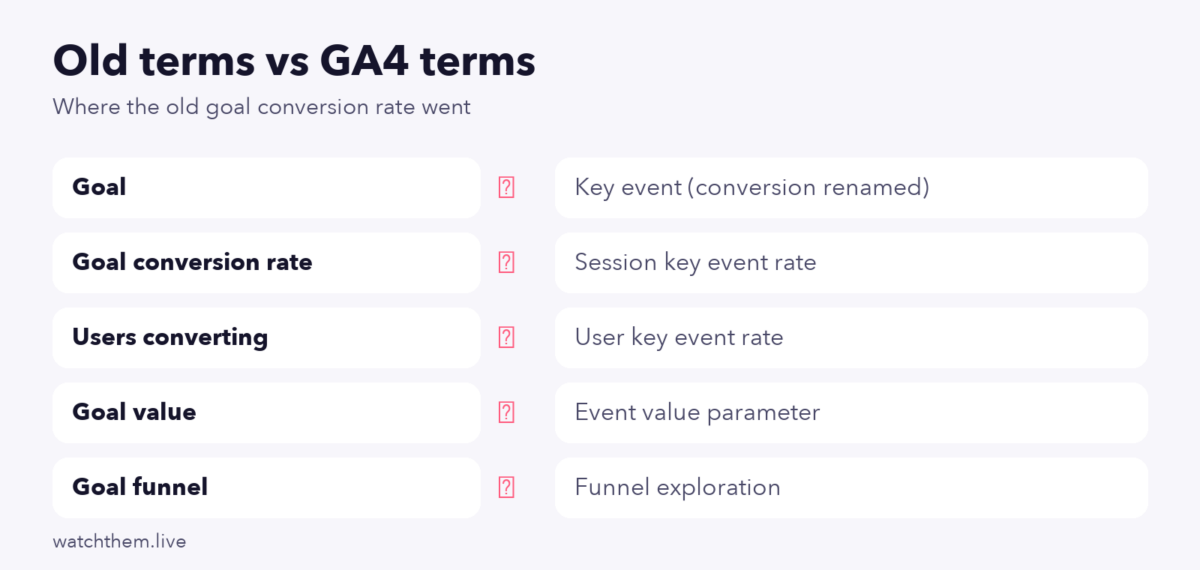
| Universal Analytics term | GA4 equivalent | Note |
|---|---|---|
| Goal | Key event | Any event can be marked as a key event |
| Goal conversion rate | Session key event rate | Sessions with at least one key event ÷ sessions |
| Per-user conversion | User key event rate | Users who triggered a key event ÷ users |
| Goal value | Event value parameter | Set on the event, not on a goal |
| Goal funnel visualization | Funnel exploration | Built in the Explore section |
How Goal Conversion Rate in Google Analytics Is Calculated
The classic formula is simple: conversion rate = conversions ÷ sessions × 100. If 4,000 sessions produce 100 completed goals, the rate is 2.5%.
GA4 adds a subtlety. The session key event rate counts sessions in which at least one key event fired, so a session with three form submissions still counts once. That means the rate is not simply total key events divided by sessions. The user key event rate does the same at the user level: if two of three users from a channel triggered a key event, the user key event rate for that channel is 66.7%.
Worked example
- 10,000 sessions in the month.
- 260 sessions contained at least one
generate_leadkey event: session key event rate = 2.6%. - Those 260 sessions came from 240 users out of 7,500 users: user key event rate = 3.2%.
Both numbers are correct. They answer different questions, so label which one you report.
Step by Step: Measure Goal Conversion Rate in GA4
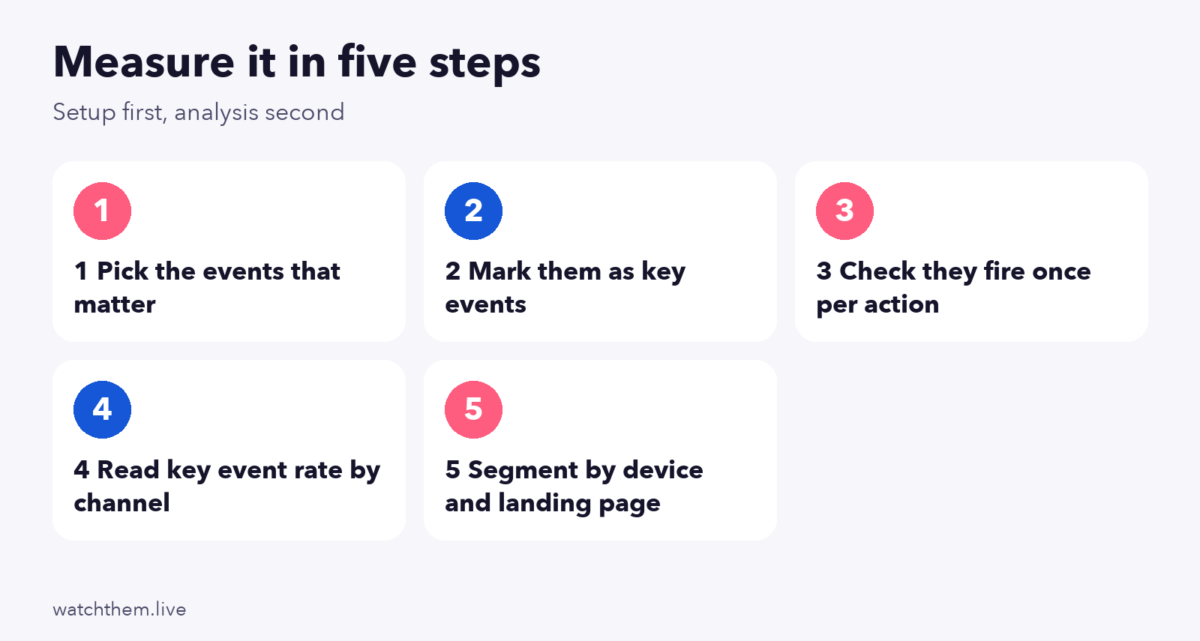
- Decide what counts as success. Typical key events are a purchase, a form submission, a signup or a booked call. Page views, form starts and video starts are useful signals, but usually not the main business result.
- Make sure the event is collected. Recommended events such as
purchaseandgenerate_leadexist, or you can create a custom event from an existing one in the Events screen. - Mark it as a key event. In the admin area open Events and switch on the key event option for that event.
- Verify it fires once per action. Use the debug view or real-time report while you complete the action yourself. Duplicate firing on reload is a classic error.
- Find the rate. Open Reports, then Acquisition, then Traffic acquisition for session-based numbers, or User acquisition for user-based numbers, and read the key event rate column for each channel.
- Go deeper in Explore. Add the metrics to a free-form exploration to break results down by landing page, device or campaign. Note that the key event rate metrics are calculated from all key events together, not from one selected event, so use per-event counts when you need an event-specific rate.
Google documents the setup in its help article on how GA4 handles key events and conversions.
Where to Slice Your Goal Conversion Rate in Google Analytics
A single site-wide rate hides the story. These cuts usually reveal the most:
- Channel: paid, organic, email and direct visitors have very different intent.
- Device: a mobile rate far below desktop often points to speed or layout problems, which our mobile conversion rate optimization guide covers.
- Landing page: pages with strong traffic and weak rates are the first test candidates.
- New vs returning: returning visitors usually convert more; compare like with like.
- Time: weekly trends beat daily noise. Compare to the same period last year for seasonal businesses.
Is Your Goal Conversion Rate Good? Put It in Context
There is no universal good number. Industry medians in published benchmark reports range from low single digits for ecommerce to double digits for some lead-generation pages, and different reports measure different things. Use benchmarks as a sanity check, then compare against your own trend. The good conversion rate benchmarks article explains how to choose a fair yardstick.
Why Your Numbers May Be Wrong
| Symptom | Likely cause | Check |
|---|---|---|
| Rate suddenly doubles | Event firing twice or on page reload | Debug view, one action at a time |
| Rate drops to near zero | Tag or thank-you page changed | Real-time report while converting |
| GA4 differs from the store or CRM | Consent mode, ad blockers, attribution differences | Compare totals, not rates, over the same period |
| Own traffic inflates sessions | Internal traffic not filtered | Define internal traffic and test the filter |
| Key event rate looks low | Too many unrelated events marked as key events or too much junk traffic | Review the list of key events and the channel mix |
Small differences between tools are normal. Large, sudden gaps are the signal to audit tracking before touching the website. If you suspect the problem is the data, a structured conversion rate optimization audit starts with exactly this step.
How to Analyze Goal Conversions and Improve Them
- Find the biggest drop. Build a funnel exploration and note the step with the largest loss. Our funnel analysis guide shows how.
- Look at behavior at that step. Watch recordings and review heatmaps. A session recording tool shows hesitation, rage clicks and form errors that charts cannot.
- Write a hypothesis. “Because many visitors abandon at the shipping step, showing the delivery cost earlier will reduce exits.”
- Test it. Run an A/B test with one primary metric, and check the setup against the CRO testing guide hygiene rules.
- Record the result. Keep a log of tests, outcomes and lessons.


Adding Value and Micro Goals
If the business has different outcomes of different worth, send an event value so reports can show revenue or lead value, not just counts. You can also mark micro steps (add to cart, pricing page view, demo video watched) as separate events to diagnose the funnel, but keep the list of key events short. When every event is a key event, the rate stops meaning anything.
Rebuilding the Four Old Goal Types in GA4
Universal Analytics offered four goal types. Here is how each is usually recreated in GA4, so nothing you used to track goes missing:
- Destination goals (a thank-you page was viewed): create a key event from the
page_viewevent with a condition on the page path, or fire a dedicated event from the confirmation page. - Event goals (a click, download or video play): use the matching recommended or custom event and mark it as a key event.
- Duration goals (sessions longer than a set time): GA4 has no direct equivalent. Engagement time and engaged sessions are the closest signals, and they work better as diagnostics than as goals.
- Pages per session goals: also replaced by engagement metrics. A session counts as engaged if it lasts longer than 10 seconds by default, has a key event or has at least two page or screen views.
Because GA4 defines bounce rate as the opposite of engagement rate, a low key event rate with a high bounce rate usually points to a traffic or message-match problem, while a low rate with good engagement points to something blocking the final step.
A Simple Monthly Reporting Template
Consistent reporting matters more than clever dashboards. A one-page monthly report can hold:
- Sessions, key events and session key event rate for the whole site, compared with the previous month and the same month last year.
- The same three numbers by channel, with a note on any channel whose volume changed sharply.
- Mobile versus desktop rate and the gap between them.
- The five landing pages with the most sessions and their rates.
- Tests started, finished and learned from, plus the next hypothesis.
Write one sentence of interpretation under each table. “Email rate fell because the new campaign sent colder traffic” is more useful than another chart. For more metrics to add when the basic report is stable, browse landing page metrics to track.
Privacy, Consent and Data Gaps
Consent banners, browser restrictions and ad blockers mean GA4 often records fewer sessions and key events than actually happened, and modeled data may fill some gaps depending on your settings. Treat the rate as a consistent indicator, not an exact census: compare it with itself over time, and cross-check totals against orders or leads in your own system. If the gap between the two stays stable, trends are reliable; if it widens suddenly, look for a tracking change.
Frequently Asked Questions
Where is the goal conversion rate in GA4?
It is the key event rate, found in the Traffic acquisition and User acquisition reports and as metrics in Explore. The “Goals” screen of Universal Analytics no longer exists.
What is the difference between conversion rate and key event rate?
Google renamed GA4 conversions to key events, so the rate metrics follow the new name. In everyday speech people still say conversion rate.
Why does GA4 show a different rate from my ecommerce platform?
Differences in session definitions, consent, blockers and attribution make exact matches unlikely. Compare totals over the same period and investigate large gaps.
Can I count more than one key event per session?
Yes, but the session key event rate still counts the session once. Use event counts when you need volume.
How many key events should I set up?
As few as your business needs, usually one to five, tied to real outcomes. Track other steps as ordinary events.
Conclusion
To measure goal conversion rate in Google Analytics today, define the outcome, mark it as a key event, confirm it fires once, and read the session or user key event rate by channel, device and landing page. Then connect the number to behavior and tests so it leads to action. For a refresher on the underlying metric, see what conversion rate means, and treat the benchmark as a starting point, not a verdict.
