

Page Contents
Last updated: October 2026
A funnel without numbers is only a diagram. Funnel metrics turn the journey from first visit to paying customer into measurable steps, so you can see where people leave, what each customer costs and how long it all takes. With the right metrics, you stop arguing about opinions and start fixing the leaks that matter most.
This guide explains what funnel metrics are, why they matter, which ten to track in 2026, how to calculate them and how to avoid common mistakes. For the measurement process itself, see our guide to funnel analysis, and for the improvement process, see funnel optimization. Where figures come from secondary sources, we say so.
What Are Funnel Metrics?
Funnel metrics are the numbers that describe how people move through each stage of a conversion funnel, from awareness to purchase or renewal. They answer four basic questions:
- How many people enter and reach each step?
- How well does each step convert?
- How much does it cost, and how much revenue does it bring?
- How long does the journey take?
Different funnels have different steps, for example an online store funnel versus a B2B lead funnel, but the same kinds of metrics apply.
Why Is Tracking Funnel Metrics Important?
1. It Shows the Real Problem
Low sales can come from poor traffic, a weak offer, a confusing checkout or slow follow-up. Funnel metrics show which stage is failing, so you do not waste time fixing the wrong thing.
2. It Improves Your Marketing Strategy
By comparing channels at each stage, you can see which sources bring people who actually convert, not just visitors. That lets you move budget to what works.
3. It Aligns Sales and Marketing
When both teams use the same definitions and numbers, such as what counts as a lead and how fast leads are contacted, they can solve problems together instead of blaming each other. See lead conversion and B2B marketing KPIs.
What Are the Most Important Funnel Metrics?
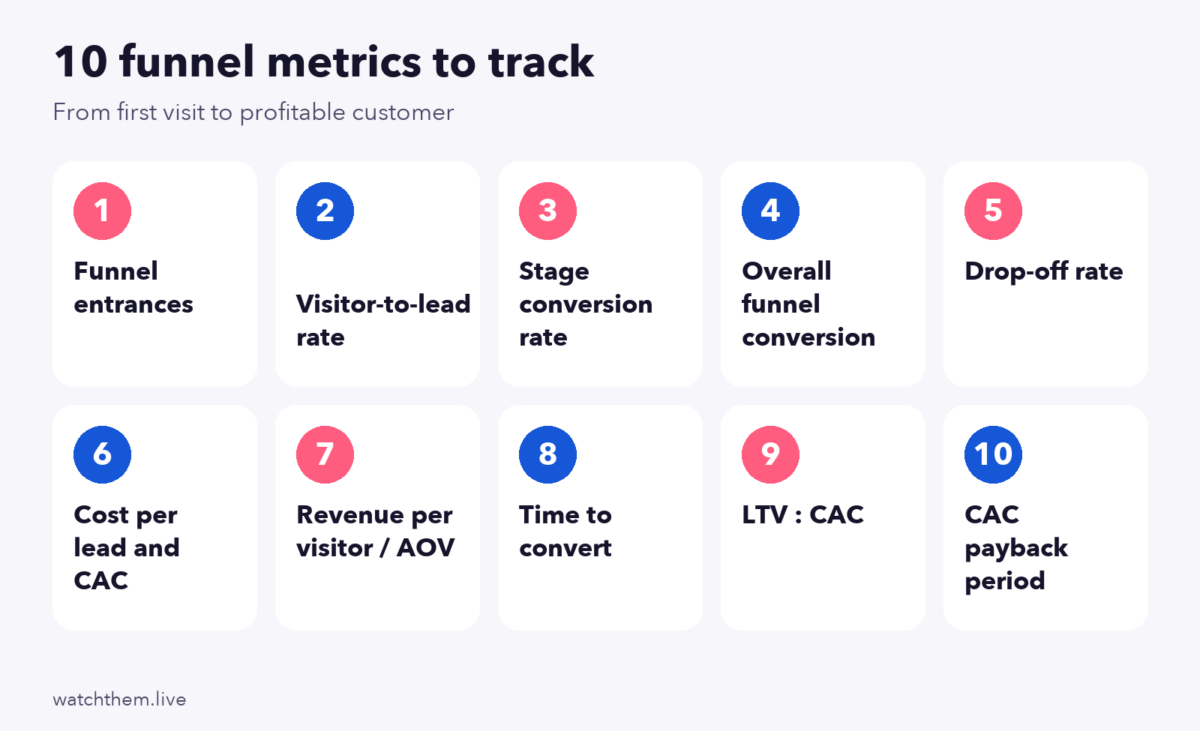
1. Funnel Entrances
The number of people who start the funnel, for example landing on a product page or a sign-up page. Track entrances by source, device and campaign, because the quality of traffic shapes everything below. In GA4, break down sessions or users by channel, and use consistent campaign tags.
2. Visitor-to-Lead Rate
The share of entrances that become leads, such as form submissions or sign-ups. Industry guides often quote about 1% to 3% as a typical range, with strong pages reaching 8% to 12%, but definitions vary, so use your own baseline. Improve it with the landing page checklist and landing page testing.
3. Stage Conversion Rate
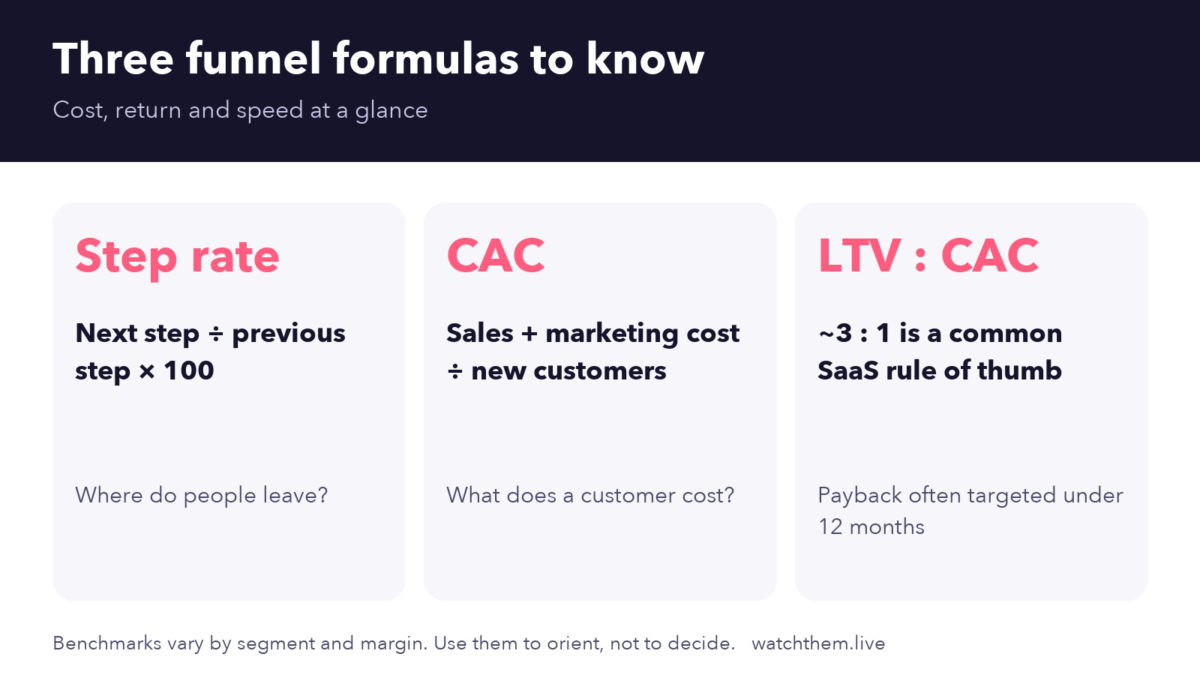
The percentage of people who move from one step to the next: the number at the next step divided by the number at the previous step, times 100. Calculate it for every pair of steps. See funnel conversion rate for examples.
4. Overall Funnel Conversion Rate
The share of people who go from the first step to the final goal. It equals the product of all the stage rates, so small gains at every step multiply. For example, four steps that each convert at 50% give an overall rate of 6.25%, and raising each to 55% lifts it to about 9.2%. Read more about conversion rate.
5. Drop-Off Rate
The percentage who leave at a step, which is 100% minus the stage conversion rate. Look at both the percentage and the absolute number of people lost. Roundups that cite Baymard Institute research put average online cart abandonment near 70%, but your own number is what matters. Study drop-off with recordings and heatmaps to learn why.
6. Cost per Lead and Customer Acquisition Cost
Cost per lead (CPL) is the marketing spend divided by the number of leads. Customer acquisition cost (CAC) is the total sales and marketing spend divided by the number of new customers in the same period. Both show whether your funnel is efficient. Our article on cost per lead explains how to calculate and reduce it. Apply the same math to outbound channels too: for example, this Contact Form Blaster review covers pricing and alternatives for contact-form outreach, which helps you estimate cost per lead before you commit.
7. Revenue per Visitor and Average Order Value
Revenue per visitor shows how much each entrance is worth. Average order value shows the typical size of an order. Together with conversion rate, they show whether growth comes from more orders, bigger orders or both. See average order value.
8. Time to Convert
How long it takes from first contact to the final goal. Short for an impulse purchase, long for a B2B deal. Track it by segment and source. If time grows, look for slow follow-up or friction. Response speed matters: the Lead Response Management study found that contacting a web lead within five minutes made it about 21 times more likely to be qualified than waiting 30 minutes, though that measured qualification, not sales.
9. LTV to CAC Ratio
Customer lifetime value (LTV) divided by CAC shows whether a customer is worth what you pay to win them. Many SaaS investors use about 3 to 1 as a rule of thumb, though sources note it varies by segment and margin, and that a very high ratio can mean you are underinvesting in growth. Calculate LTV from gross margin, not revenue, where you can.
10. CAC Payback Period
The time needed to earn back the cost of acquiring a customer, usually calculated as CAC divided by monthly gross profit per customer. Many sources suggest a target under 12 months for B2B SaaS, with longer periods accepted for enterprise deals with multi-year contracts. Looking at payback together with LTV to CAC gives a fuller picture of cash flow.
How to Track Funnel Metrics
- Define the steps and the goal for each main funnel.
- Set up tracking. In GA4, create events for each step, mark the main goal as a key event and build a funnel exploration. Note that GA4 funnels are closed by default, and a user who skips a step drops out of the later steps.
- Connect cost and revenue data from your ad platforms, CRM and store, so you can calculate CPL, CAC and revenue.
- Add behavior tools. Goal and event tracking, session recordings and heatmaps show why people leave at a step.
- Segment the data by device, source and new versus returning visitors.
- Review regularly, weekly for key numbers and monthly for trends.

A Simple Example
An online store spends $2,000 on ads in a month and gets 10,000 visitors. Of them, 3,000 view a product, 600 add to cart, 300 start checkout and 150 buy at an average order value of $60. The stage rates are 30%, 20%, 50% and 50%, and the overall conversion rate is 1.5%. Revenue is $9,000, so revenue per visitor is $0.90, the cost per order is about $13.30 and ad spend is about 22% of revenue. If the store raises checkout completion from 50% to 60%, it gets 180 orders from the same traffic, a 20% increase in sales, without buying a single extra visitor.
Funnel Metrics Benchmarks: Use With Care
Benchmarks help you orient, but they are rarely comparable between companies. Recent B2B studies report lead-to-customer rates of about 2% to 5%, with one industrial-sector study averaging about 2.7% and top performers above 7%. Some 2026 roundups cite end-to-end conversion of roughly 1% to 5% for B2B and 5% to 15% for B2C and e-commerce, while definitions of the first and last step vary widely. Use these as rough guides and compare your funnel with its own history and segments.
Common Funnel Metrics Mistakes
- Tracking too many numbers. Choose the handful that drive decisions.
- Inconsistent definitions, such as counting sessions in one report and users in another.
- Looking only at averages, which hide differences between channels and devices.
- Ignoring cost and revenue. A high conversion rate that costs too much to win is not a success.
- Broken tracking, which creates fake drop-offs. Test events after every change.
- Not acting on the numbers. Every metric should lead to a test or a fix. See conversion rate optimization strategies.
Frequently Asked Questions About Funnel Metrics
What are funnel metrics?
Funnel metrics are numbers that measure how people move through each stage of a conversion funnel, including how many enter, how many continue, what it costs and how much revenue results.
What are the most important funnel metrics?
Entrances, visitor-to-lead rate, stage conversion rate, overall conversion rate, drop-off rate, cost per lead and CAC, revenue per visitor, time to convert, LTV to CAC and payback period.
How do you calculate funnel conversion rate?
For one step, divide the number of people at the next step by the number at the previous step and multiply by 100. For the whole funnel, divide the people who reach the final goal by the people who entered, and multiply by 100.
What is a good LTV to CAC ratio?
Many sources cite about 3 to 1 as a SaaS rule of thumb, but it depends on your segment, margins and growth goals, so use it as orientation, not as a rule.
How often should I review funnel metrics?
Check core numbers weekly, do a deeper review monthly and review again after any change to your site, pricing or campaigns.
Conclusion
Funnel metrics show where your growth is leaking and what it costs to fix. Track entrances, stage and overall conversion, drop-offs, cost, revenue, time and the long-term return on each customer. Segment the data, pair it with recordings and heatmaps to understand why people leave and use what you learn to prioritize your next test. Small gains at each stage compound into much better results from the same traffic.
