Page Contents
If you are wondering how effective your CRO strategies are, tracking website metrics is the best way to find out. As we live in an age of data-driven analytics, monitoring these metrics is more crucial than ever. It helps you identify and choose the right strategies so you won’t waste your marketing resources on ineffective ones.
Furthermore, website metrics show you which areas of your website need improvement to increase conversions.
You might be overwhelmed by the vast number of website metrics. So, in this blog post, we will discuss the most important ones and see how each can help you optimize your conversion rate. We will also introduce a great tool for tracking metrics at the end of this post.
Related Article: Key Website Performance Metrics You Need to Analyze
What Are Website Metrics?
Website metrics are a set of measurements that help you track your website’s performance or the visitors’ behavior and activities. They offer valuable insights that are not easily obtained in any other way.
Tracking website metrics has many benefits; it provides direction for your marketing efforts and helps you make better decisions.
10 Key Website Metrics You Need to Track
Here are the most important website metrics that you must be tracking to boost conversions:
1- Interactions Per Visit
Not all of your website visitors are going to convert. That’s why you have to understand how they interact with your website to find out how to encourage them to take action.
Tracking user interactions enables you to identify the micro-conversions, the small steps that users take to reach the conversion goal. It can be a newsletter subscription, viewing a product page, or commenting on a blog post.
These small but key interactions play a big role in motivating visitors to convert; therefore, it’s necessary to make effective changes to make the most out of them.
2- Value Per Visit
The value per visit metric indicates the amount of value you get out of each visitor. It seems simple, but actually calculating the value of each visit isn’t always easy.
To calculate this metric, you only need to divide the total value you have gained by the number of visits.


The problem is that sometimes you won’t get the value immediately, or it’s not in a tangible form. For example, your eCommerce websites’ customers not only create value by making a purchase but might also create intangible value when they recommend one of your products on social media.
Related Article: Key eCommerce Metrics That You Should Be Tracking in 2021
3- Average Time Spent on Website
This metric shows you how much time visitors spend on your website on average per visit. It’s also a good idea to track how long they spend on each web page.
55% of visitors leave a web page in less than 15 seconds. Therefore, you need to capture their attention in a few seconds to make them stay for longer and become interested in what you have to offer. And this is possible by producing high-quality content.
The more engaging your content, the more visitors will be encouraged to convert. Also, analyzing the average time spent on your website is an excellent way to measure your content’s engagement.
It’s a great strategy to find the pages that make visitors abandon your website quickly and try to improve them to increase your CR.
Moreover, the time users spend on your website affects your SEO ranking. If people are immediately leaving your website, it means they’re not finding your content useful, so your ranking would decrease.
4- Cost Per Conversion
Calculating the cost per conversion tells you how much you spend to convert a potential customer.
![]()
![]()
You might have a high conversion rate, but if your cost per conversion is also high, you’re in trouble.
A high CPC could result in a zero or negative net profit, which means the money you spend on converting prospects is more than the amount you’re making.
If you need to lower your CPC, reconsider your marketing strategies and try to find more cost-effective ways to attract customers. Besides, make sure increasing your conversion rate doesn’t mean increasing your CPC as well.
Related Article: Cost Per Lead Formula and Calculator
5- Landing Pages
Users can land on different pages of your website through Google search, social media, marketing emails, or any other way. It’s essential to identify the pages people land on the most to optimize them. These pages provide you with a great opportunity to pique the interest of many visitors.
6- Exit Pages
This website metric shows you at what point visitors leave your website. It’s necessary to detect the high-exit pages to figure out what’s preventing users from reaching your website’s goal.
For example, you discover many visitors are leaving your website on the shopping cart page. This can be a sign that something is making users dissatisfied or there’s a bug. Maybe you haven’t provided clear shipping information, or your checkout button is not working.
Here are some tips for optimizing your exit pages:
- Make sure your call to actions are clear enough.
- Make your website easy to navigate.
- Minimize the number of steps users need to follow to complete a goal.
7- New Visitors Vs. Returning Visitors
Tracking visitors’ IP addresses is how you can determine whether someone is visiting your website for the first time or not. If a user is revisiting your website, they are likely more interested in your offer. Therefore, it’s easier to convert return visitors rather than new ones. That’s why you must design strategies to increase your returning visitors.
Try to create content that catches your audience’s attention to keep them coming back to your website. If you are wondering how to elevate your content marketing, producing snackable content is an excellent strategy.
Furthermore, include links to your website in your marketing emails to entice customers to return.
8- Traffic Sources
This website metric tells you where your website traffic comes from. Knowing your website’s traffic sources helps you understand how your advertising campaigns are performing and which channels are bringing more traffic.


Additionally, keep an eye on how users from each source interact with your website to see which are more relevant. If the visitors from a specific source abandon your website straight away, they might not belong to your target audience. So, you probably should figure out how to get qualified traffic from this channel or put more focus on other ones.
9- Bounce Rate
This key website metric indicates the percentage of your visitors who leave without interacting with your website.


Hence, if you have a high bounce rate, you have to find out why as soon as you can.
Find the pages with high bounce rates and see what you can do to keep visitors on the page and persuade them to take action. These are some of the reasons for a high bounce rate:
- Poor website design
- Irrelevant traffic sources
- Slow page speed
- Poor user experience
10- Pageviews
Pageviews let you know how many people check out your content. While traffic is not as important as other website metrics for increasing conversions, it’s necessary to have a reasonable amount of traffic for your business to survive. If you have a high conversion rate but only a few visitors in a month, you’re not getting anywhere.
Tools for Tracking Website Metrics
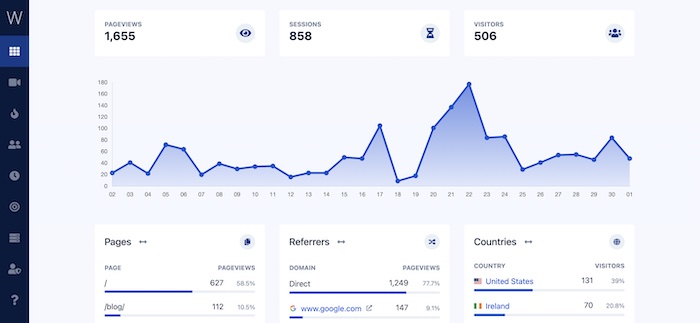
If you’re looking for a tool for tracking and analyzing website metrics, you can use a behavioral analytics tool such as Watch Them Live. Besides website analytics, this tool offers useful features, such as session replays and heatmaps, that help you understand how to improve your website metrics.


On the dashboard, you can find your landing pages, exit pages, and pages with higher bounce rates. These are the pages where the WTL’s features can be very helpful.


Let’s see how you can use each feature to optimize your website:
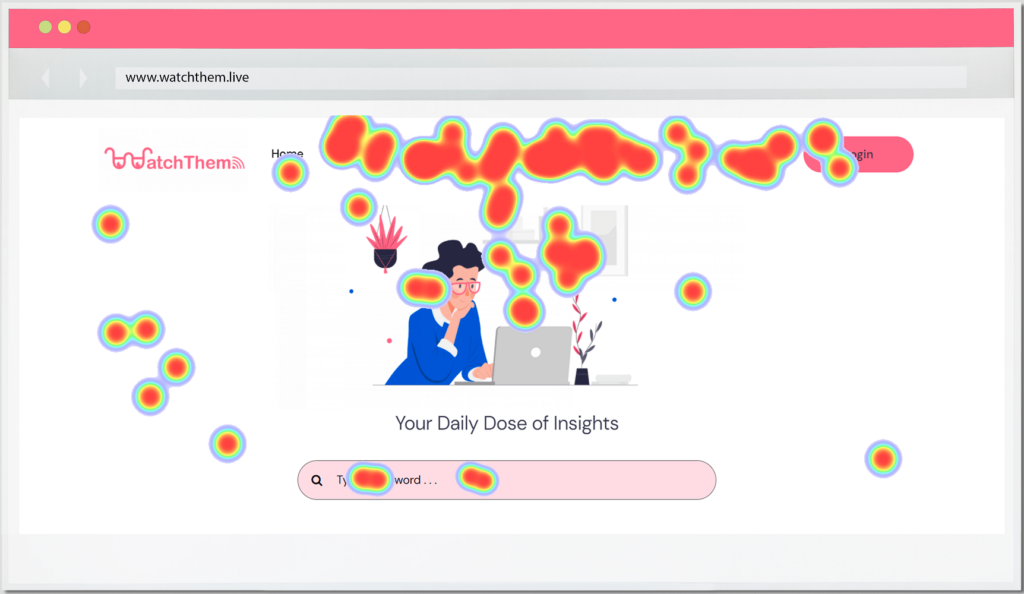
Heatmaps
With the heatmap service, you will be able to see a visual representation of your visitors’ activity on your website. You can improve your landing pages and exit pages by creating heatmaps for these pages.
See what elements users are clicking most and if they are paying attention to CTAs. Are there any distracting elements preventing them from taking action? Where are the popular areas on your web pages? This information allows you to better understand how to optimize the pages.


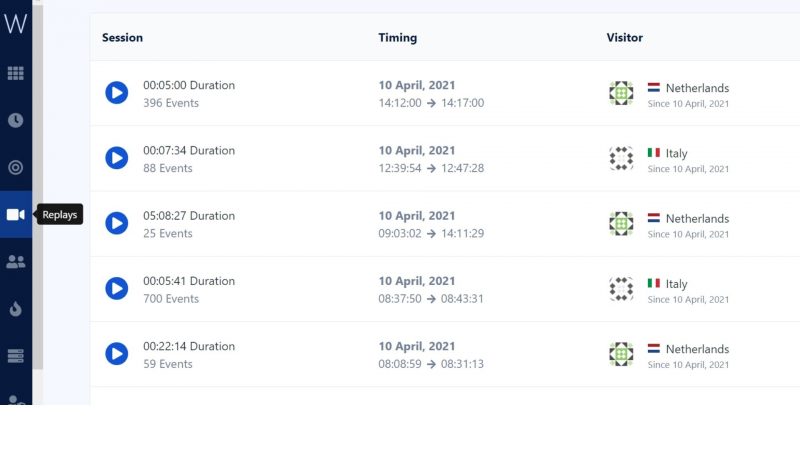
Session Replays
Session replays are a powerful feature that enables you to watch users’ journeys on your website. You can see all their interactions, what actions lead them toward your website’s goal, and what makes them leave.


Try out Watch Them Live now! Choose the plan that suits you best and get your free trial.
Conclusion
In this article, we discussed the most important website metrics which tracking them would help you increase your conversions. By analyzing these metrics, you can make better decisions to grow your business.
If you want to track your website metrics more effectively, using a behavior analysis tool can help you a lot.

