

Page Contents

Last updated: October 2026
Most visitors never buy on their first visit. They look at a product, watch a video, join a newsletter or add something to a cart and leave. Each of those small steps is a micro conversion, and tracking them is one of the fastest ways to understand why your main conversion rate is stuck. Recent benchmark roundups put the average e-commerce conversion rate at roughly 2–3%, which means about 97 of every 100 visitors leave without buying. The micro conversions tell you what those people did before they left.
This guide explains what micro conversions are, gives examples for different types of websites, shows how to track them in Google Analytics 4 and explains how to turn the data into more sales or leads. If you want a side-by-side comparison, see our dedicated article on micro conversion vs. macro conversion.
What Are Micro Conversions?
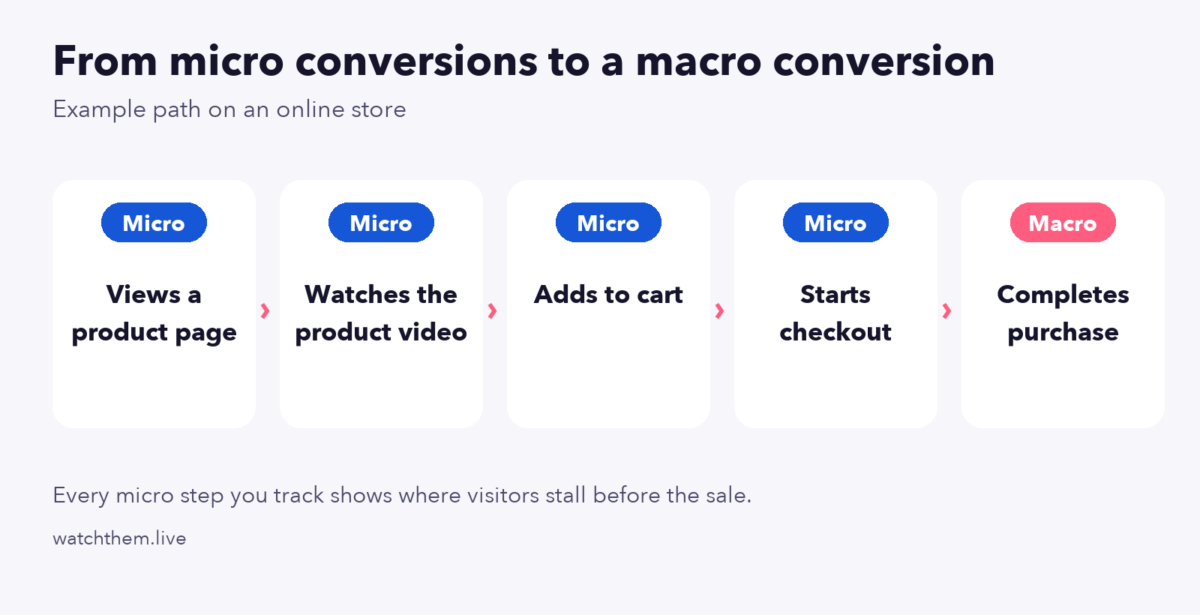
A micro conversion is a small action that shows a visitor is moving toward your main goal. The main goal is the macro conversion, for example a purchase, a paid sign-up or a qualified lead form. Micro conversions do not bring revenue by themselves, but they signal interest and reveal how people move through your funnel.
Think of an online shoe store. Viewing a product, choosing a size, adding the shoes to the cart and subscribing to the newsletter are all micro conversions. The completed order is the macro conversion. If many visitors add shoes to the cart but few start checkout, you know where to look.
Why Do Micro Conversions Matter?
Focusing only on the final conversion means ignoring most of your audience. Micro conversions matter for several reasons.
They Show Where Visitors Drop Off
A single overall conversion rate tells you something is wrong but not where. When you track each step, a sharp fall between two steps points straight at the page or element to fix. This is the foundation of any funnel optimization work.
They Help You Understand User Behavior
Watching which small actions people take reveals what they care about. If visitors watch your product videos but rarely add to cart, the content interests them but something about price, shipping or trust holds them back.
They Give You Faster Feedback
Macro conversions can be rare, so tests take a long time to reach reliable results. Micro conversions happen more often, so you can see the effect of a change in days instead of weeks. That makes them useful as supporting metrics in experiments.
They Identify Your Best Visitors
Visitors who complete several micro conversions, such as reading pricing pages and downloading a guide, are usually warmer leads. You can segment them for email follow-up or remarketing.
They Reveal UX Problems
If a button gets clicks on desktop but almost none on mobile, the design may be at fault. Pairing micro conversion data with recordings and heatmaps shows the exact problem. For more on this, read about CRO and UX and key website UX metrics.
They Make the Most of Existing Traffic
Instead of paying for more visitors, you improve what happens after they arrive. That is the core idea behind conversion rate optimization.
Micro Conversion Examples
The right micro conversions depend on your business model. Here are common examples by site type.
E-commerce
- Viewing a product page or a category page
- Using site search or filters
- Watching a product video or opening the image gallery
- Selecting a size or color
- Adding a product to the cart or a wish list
- Starting the checkout
- Subscribing to the newsletter or a back-in-stock alert
- Reading reviews
SaaS and Lead Generation
- Visiting the pricing page or the features page
- Watching a demo video
- Downloading an ebook or checklist
- Starting a form but not finishing it
- Using a calculator or interactive tool
- Opening a live chat conversation
- Clicking a contact or phone link
Content and Media Sites
- Scrolling past 75% of an article
- Reading more than one article in a session
- Sharing a post or leaving a comment
- Clicking an internal link or a related post
- Signing up for email updates
How Common Are These Actions?
Benchmarks help you judge your own numbers. One of the most-tracked micro conversions in e-commerce is the add-to-cart rate. Several 2025 roundups put the global average at about 6%, with some reports giving a range of 6% to 11% depending on method and sample. Braze’s August 2025 figures, for instance, show beauty and personal care near 9%, food and beverage near 7% and luxury and jewelry near 2.4%.
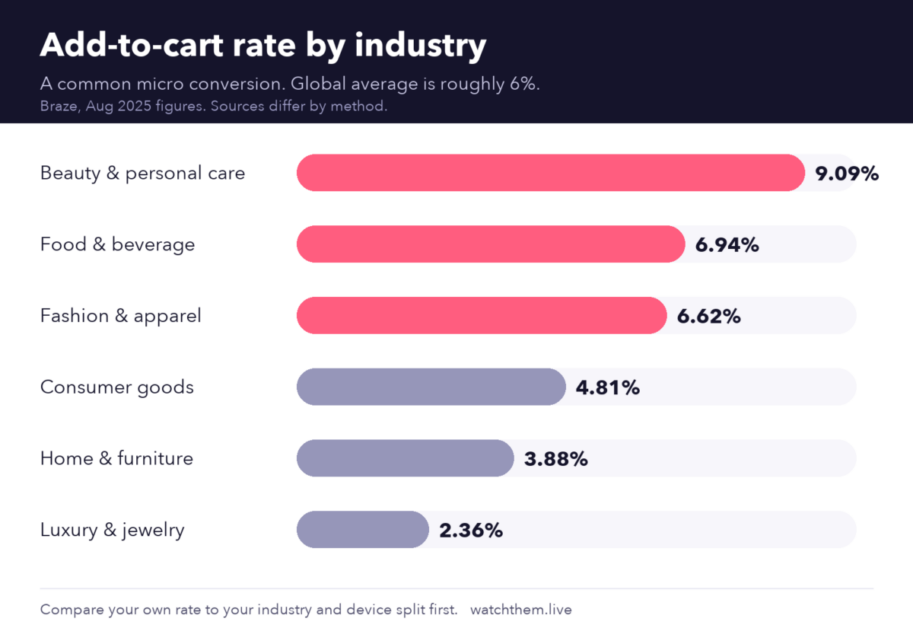
Treat these as direction rather than targets, since vendors measure differently. A rate far below your industry norm, or one that drops after a site change, is a sign to investigate. For macro benchmarks, see e-commerce conversion rate benchmarks and what is a good conversion rate.
How to Track Micro Conversions
You can track micro conversions with an analytics platform, a behavior-analytics tool, or both.
Track Micro Conversions in Google Analytics 4
In Google Analytics 4, everything is an event. Some are collected automatically, some are recommended by Google and some are custom events you define. Here is the general process:
- List the actions. Choose the five to ten micro conversions that matter for your business, and write down what counts as each one.
- Create the events. Use recommended events such as
add_to_cart,begin_checkout,sign_upandgenerate_leadwhere they fit. For anything else, create a custom event with a clear name, for examplevideo_playorpricing_view. Avoid relying on the genericpage_viewevent, because it fires on every page. - Send the events. Add them with the Google tag or with Google Tag Manager.
- Mark the important ones as key events. In 2024 Google renamed “conversions” to “key events” in GA4. You can mark an event as a key event from the Events or Key Events section of the admin area, or create it there by entering the exact event name.
- Keep primary key events few. Many practitioners suggest marking only the highest-value actions as key events and watching the rest as regular events, so your reports stay readable.
- Build a funnel report. Use the Explore section to see how many users move from step to step.
Note that a GA4 key event does not automatically feed Google Ads bidding. It has to be imported and linked separately. For a deeper walkthrough of goals, see how to measure goal conversion rate in Google Analytics, and our guide to analytics for CRO.
Track Micro Conversions With Behavior Analytics
Analytics counts actions but cannot show what the visitor saw or felt. A behavior-analytics tool fills that gap:
- Session recordings let you watch visitors who completed or abandoned a micro step.
- Heatmaps show which buttons and links attract clicks and where people stop scrolling.
- Goal and event tracking counts clicks, page visits and form submissions without code changes to every page.
- Website analytics lets you filter results by device, country and traffic source.


How to Improve Your Micro Conversions
Once you can see the numbers, use these tactics to move them.
- Make the next step obvious. Every page should have one clear action, with a button that stands out and text that tells visitors what happens next.
- Reduce friction. Shorten forms, remove unnecessary fields and offer guest checkout. Watch recordings to find the field that makes people quit.
- Add proof near the action. Ratings, reviews and guarantees next to an add-to-cart or sign-up button make the step feel safer.
- Fix the mobile experience. If mobile micro conversions trail desktop, test tap targets, loading speed and pop-ups on real phones.
- Use content as a bridge. Offer a useful guide, checklist or calculator to capture visitors who are not ready to buy, then follow up by email.
- Test one change at a time. Run A/B tests, wait for reliable results and record what you learn. See our conversion rate optimization strategies for a full testing checklist.
Common Mistakes to Avoid
- Tracking everything. Dozens of events create noise. Pick the ones tied to your funnel.
- Treating micro conversions as the goal. A higher newsletter sign-up rate is only good if it leads to more sales or leads over time.
- Using vague event names. Use consistent names such as
add_to_cartso reports stay clear. - Ignoring segments. Compare mobile and desktop, new and returning visitors, and traffic sources, because averages hide problems.
- Not checking the data. Test every event after you set it up, and re-check after site updates, because broken tracking is common.
Frequently Asked Questions About Micro Conversions
What is a micro conversion?
A micro conversion is a small action, such as watching a video, joining a newsletter or adding a product to the cart, that shows a visitor is moving toward a main goal like a purchase.
What is the difference between micro and macro conversions?
A macro conversion is the main business goal, such as a sale or a qualified lead. Micro conversions are the smaller steps that lead to it. You need both: macro conversions measure results, micro conversions explain them.
Should I mark micro conversions as key events in GA4?
Only mark the actions that matter most. Too many key events make reports confusing. Track the rest as regular events and use them in funnel reports.
How many micro conversions should I track?
Start with five to ten that match the steps of your funnel. Add more only when you have a clear question the data can answer.
What is a good add-to-cart rate?
Roundups suggest a global average of about 6%, with big differences by industry and device. Compare with your own history and your sector rather than a single number.
Conclusion
Micro conversions turn a single, hard-to-diagnose conversion rate into a clear map of your visitors’ journey. Choose the handful of small actions that lead to your main goal, track them in GA4, add recordings and heatmaps to see the reasons behind the numbers, and fix the biggest drop-off first. Over time, small improvements at each step add up to a noticeably higher conversion rate from the same traffic.
