
Page Contents
Last updated: November 2026
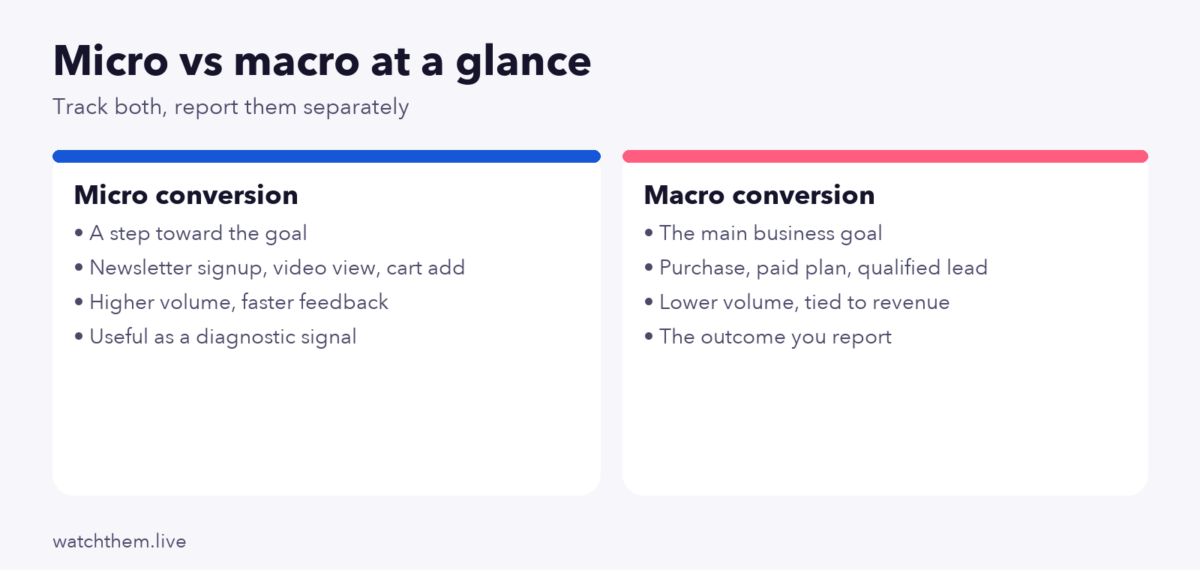
Micro conversion vs macro conversion is the difference between a small step toward a goal and the goal itself. A macro conversion is the main outcome your business exists to get: a purchase, a paid subscription, a qualified lead. A micro conversion is a smaller action that suggests interest or moves someone closer: adding an item to the cart, watching a product video, joining a newsletter. Tracking both gives you the result and the reasons behind it.
Quick Answer: Is This Action Micro or Macro?
Ask three questions about any action on your site:
- Would the business count it as success on its own? If yes, it is probably a macro conversion.
- Does it usually come before something bigger? If yes, it is probably a micro conversion.
- Does it bring revenue or a sales opportunity directly? If yes, treat it as macro; if only indirectly, micro.
The same action can change category depending on the business. For a publisher, a newsletter signup may be the main goal; for an online store, it is a micro step toward a purchase. Define the categories for your own model and write them down.
Micro Conversion vs Macro Conversion Side by Side
| Aspect | Micro conversion | Macro conversion |
|---|---|---|
| Meaning | A smaller action that shows progress or interest | The primary business goal |
| Examples | Cart add, video view, wishlist, pricing page visit, newsletter signup | Purchase, paid plan, booked sales call, qualified lead |
| Volume | High | Lower |
| Feedback speed | Fast, useful in small tests | Slower, needs more traffic |
| Direct revenue | Usually none | Yes or close to it |
| Main use | Diagnose the journey and find friction | Report results and judge business impact |
| Risk if overweighted | Optimizing activity that never pays | Missing where the journey breaks |
Two Kinds of Micro Conversion
Usability research distinguishes micro conversions that are process milestones from those that are secondary actions. The Nielsen Norman Group describes micro conversions as measures of progress toward a larger goal. In practice:
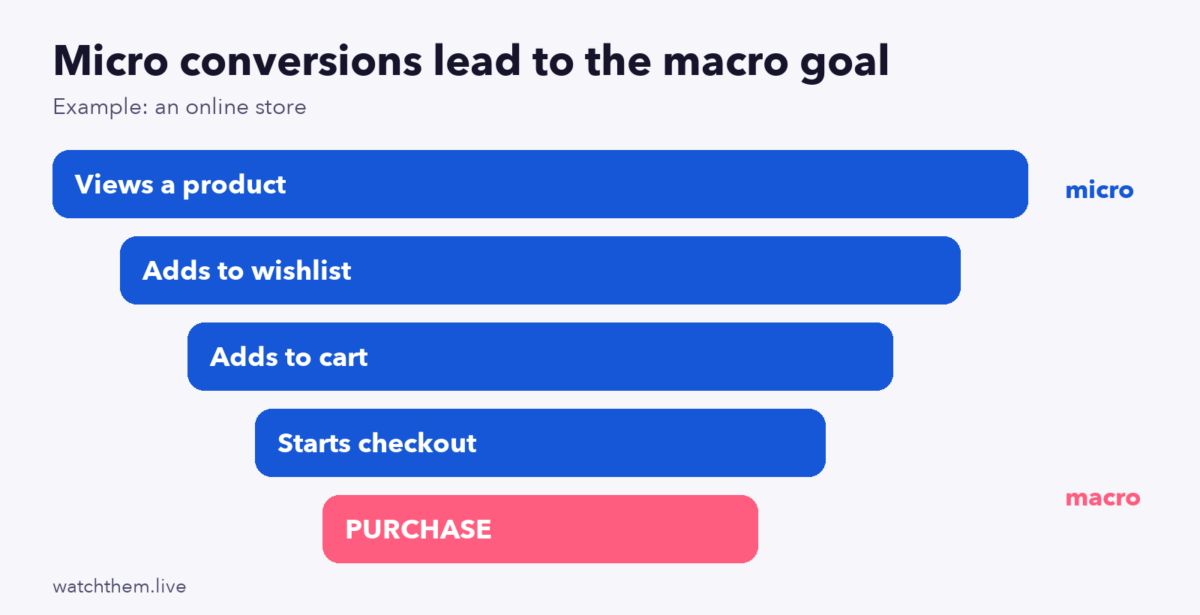
- Process milestones sit on the path to the macro goal: product view, add to cart, start checkout, start a signup form.
- Secondary actions are related behaviors that may predict value but are not required steps: subscribing to a newsletter, downloading a guide, following on social media, watching a demo video.
The distinction matters for analysis. Process milestones belong in a funnel where drop-off between steps is meaningful. Secondary actions are better treated as engagement signals whose link to later purchases you verify with data before relying on it.
Examples by Business Type
| Business | Macro conversion | Useful micro conversions |
|---|---|---|
| Online store | Completed order | Product view, size guide opened, add to cart, checkout started, coupon applied |
| SaaS product | Paid subscription or activated account | Pricing page view, signup started, first project created, teammate invited |
| B2B services | Qualified sales lead or booked call | Case study read, whitepaper download, contact form started |
| Publisher or blog | Newsletter subscriber or membership | Scroll to 75%, second article viewed, comment posted |
| Local business | Booking or phone call | Directions clicked, opening hours viewed, gallery opened |
| Nonprofit | Donation | Impact story read, volunteer page visited, event registration |
How the Two Work Together in a Funnel
Picture a store where 10,000 visitors view products, 1,500 add to cart, 600 start checkout and 250 buy. The macro conversion rate is 2.5% of visitors, which tells you the outcome but not what to fix. The micro steps show that only 40% of people who start checkout finish it, so the problem sits late in the journey. That is where you look first. The funnel analysis approach turns step-by-step numbers into a prioritized list.
Micro conversions also help when traffic is thin. A test measured on purchases may need months to reach a reliable result; a test measured on add-to-cart rate can finish sooner. Use that shortcut carefully: a variant that raises micro conversions but lowers purchases is a loser, so confirm the effect on the macro goal where you can.
How to Choose Which Micro Conversions to Track
- Map the journey. List the steps a typical buyer takes, from landing to purchase.
- Mark where people leave. Pick micro conversions at the steps with the largest drop-offs.
- Check the link to value. Compare buyers and non-buyers: do buyers do the micro action more often? If not, it is a vanity metric.
- Keep the list short. Three to eight micro conversions are easier to act on than thirty.
- Review quarterly. Journeys change; retire metrics that no longer help.
Tracking Micro and Macro Conversions in GA4
In Google Analytics 4, every action is an event. Mark your macro conversions as key events, and keep micro conversions as regular events unless you need them in key event reports. Marking everything as a key event dilutes the rate. Read the setup details in measuring goal conversion rate in GA4, and always verify each event fires once per action.
Give events clear names (add_to_cart, begin_checkout, generate_lead) and, where possible, use Google’s recommended names so reports work out of the box.
Reading Behavior Behind the Numbers
A micro conversion rate tells you that something happens or does not; it cannot tell you why. Heatmaps and recordings fill the gap: you can see whether people never notice the add-to-cart button, hesitate at a shipping message or struggle with a form field.


A session recording solution lets you watch the sessions behind a drop-off. Pair what you see with a test: write a hypothesis, change one thing and measure the micro and macro effects, as described in the CRO testing guide for the full process.
A Worked Example: Reading the Funnel Step by Step
Imagine a SaaS company with 8,000 monthly visitors to its pricing and product pages. Data for one month shows 1,200 visitors view pricing (15%), 320 start a signup (4%), 190 finish signup (2.4%) and 60 become paying customers (0.75%). Each number answers a different question:
- Pricing view to signup start (27%): healthy interest; the message and plan layout work well enough.
- Signup start to finish (59%): four in ten abandon the form. Recordings might reveal a required field that confuses people.
- Signup to paying (32%): depends on the product experience after signup, which is an onboarding topic more than a landing page one.
Without the micro steps the team would only see 0.75% and guess. With them, the first test is clear: simplify the signup form and measure the finish rate and the paying-customer rate together.
How to Report Both Without Confusing Stakeholders
Keep reports simple. Show the macro conversion rate first, as the headline result, then a small table of micro conversion rates for the steps that matter, each with its trend. Label which are diagnostic signals and which are goals. If a micro number improves but the macro number does not move after a reasonable period, say so plainly and note what you will investigate next. This habit protects the team from celebrating activity instead of outcomes.
It also helps to review how micro conversions relate to other numbers on your dashboard, such as bounce, time on page and scroll depth. The website metrics overview explains which of these are worth keeping.
Common Mistakes
- Treating every click as a conversion. Clicks are not outcomes unless they predict value.
- Celebrating micro wins that do not pay. A free ebook with thousands of downloads and no sales pipeline is a signal worth questioning.
- Using different definitions in different reports. Agree on definitions and keep them stable so trends are comparable.
- Ignoring the macro rate while testing. Always include the primary outcome as a guardrail.
- Not segmenting. Mobile and desktop visitors often differ sharply at the same step; see the mobile CRO guide for common mobile friction.
How to Calculate Each Rate
- Macro conversion rate = macro conversions ÷ visitors (or sessions) × 100. Example: 250 orders ÷ 10,000 sessions = 2.5%.
- Micro conversion rate = micro conversions ÷ visitors (or sessions that reached the step) × 100. Example: 1,500 cart adds ÷ 10,000 sessions = 15%.
- Step conversion rate = people completing a step ÷ people who reached it. Example: 250 ÷ 600 = 41.7% of those who started checkout.
State the denominator each time. The same number can be a rate of sessions, users or step entrants. For a refresher, see how conversion rate is calculated.
Frequently Asked Questions
What are examples of micro conversions?
Adding to cart, signing up for a newsletter, downloading a guide, watching a video, viewing a pricing page and starting a form are common examples.
What are macro conversions in digital marketing?
They are the primary goals: a sale, a paid subscription, a qualified lead or a booked appointment, depending on the business model.
How do I calculate the macro conversion rate?
Divide macro conversions by visitors or sessions and multiply by 100. For example, 250 orders from 10,000 sessions is 2.5%.
Can a micro conversion become a macro conversion?
Yes. If a small action reliably produces revenue, such as a free trial for a SaaS company, many teams treat it as macro. Classify by business value, not by size of the action.
How many micro conversions should I track?
Typically three to eight tied to funnel steps. More becomes noise.
Which matters more?
The macro conversion is the outcome; micro conversions explain it. You need both.
Conclusion
Micro conversion vs macro conversion is a question of role: macro conversions measure success, micro conversions show the path and the friction. Define both for your business, track a short list of micro steps that actually predict value, and always check changes against the macro result. If you want to see where to start, review your conversion funnel stages and pick the step with the biggest drop.
