Page Contents
Have you ever wondered what customer success metrics are and why they’re so important?! Well, all companies today realize the importance of customer experience and try their best to keep ahead of the competition. Despite the changing world of marketing and increased customer demands, it’s important to know how to deal with unhappy customers and keep them satisfied.
As you have already heard, both customer support and customer success highly impact customer experience. And the experience will help you achieve positive outcomes and growth! So, whether you have an eCommerce customer experience or not, building an amazing customer experience is necessary.
To help you do so, customer success metrics come to play. But what are these metrics, and how do you measure them? That’s what we’re here to answer!
In this article, we’ll give you twelve customer success metrics to measure in order to keep your business on track. Furthermore, we will introduce you to the best behavior analytics tool, WatchThemLive, to boost your revenue by reducing customer churn.
Customer Success Metrics Definition
Before we move on to listing the items, we need to clarify the definition! Customer success is the effort you take to help your clients achieve their goals. And there are some customer success metrics that you can track to see if your strategies are working effectively or not. But what is that?!
A customer success metric is a quantifiable measure that determines how well a company can achieve its objectives in helping its users get the most out of its products or services.
Now, let’s see what these items are!
What Are the Metrics of Customer Success
According to Forrester Research, over 72% of businesses take improving customer success as their top priority. So I’ll gather ten customer success metrics to help you reduce customer churn rate and accelerate your business growth.
Now, shall we dive deep into the most important customer success metrics?
1. Conversion Rate
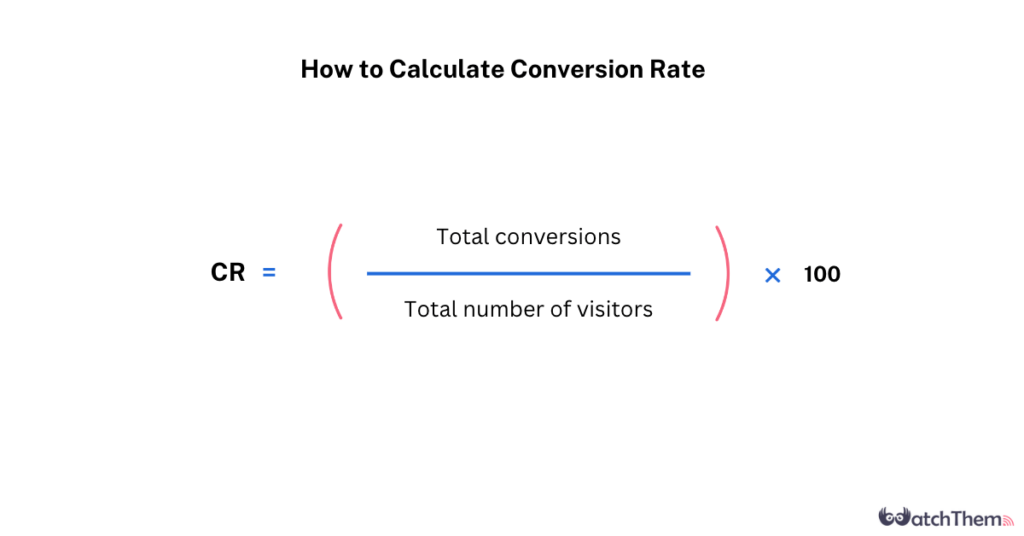
Let’s begin with one of the important customer success metrics that shows the percentage of visitors who complete your desired action and become customers such as making a purchase, signing up for a subscription, or upgrading a service.
To calculate the conversion rate, first, you need to define your conversion for your business. Then, you need to divide the number of conversions you can get in a specific time by the total number of visitors and multiply it by 100%.
For example, if your website receives 20 visitors in a week and has only 5 sales, the conversion rate would be 5 divided by 20, or 25%.

If you’re looking for a way to boost your conversion rate with your eyes closed and identify customer pain points to reduce the churn rate, WatchThemLive is the best solution!
This user-friendly behavior analytics tool has many useful features, such as session replay and heatmaps, that can help you understand your customers’ behaviors, monitor their activities on your website, and improve your customer experience. Let’s take a closer look at each of them:
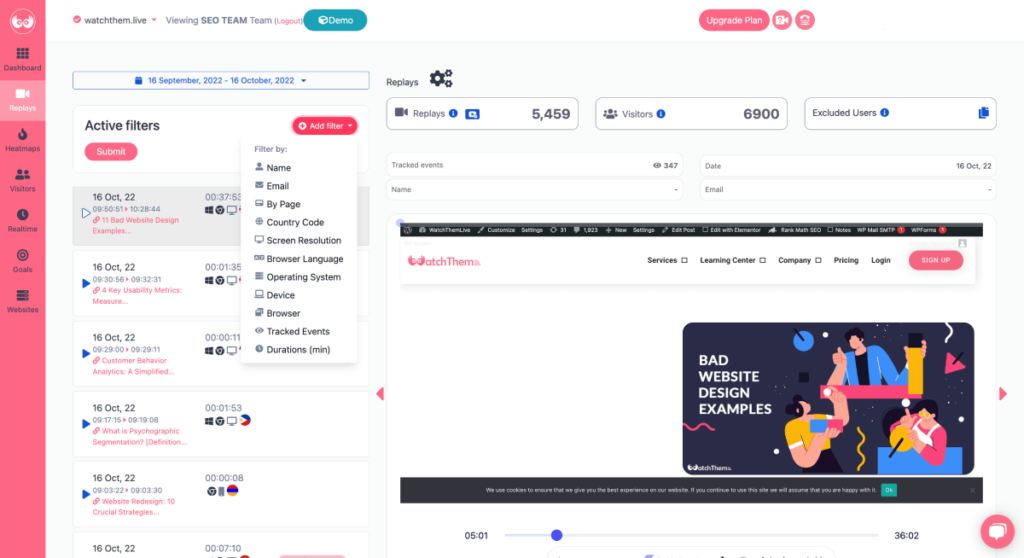
1) Session Replay
WatchThemLive’s session recording tool allows you to segment your audiences by adding different filters to the recordings. You can also follow some of your best customers to understand their behavioral patterns through their buying process and realize what makes them complete your desired action. So you can easily increase your retention rate in no time.

2) Heatmaps
With WatchThemLive’s heatmaps, you can select specific pages and see how customers interact with your website’s elements to optimize your site in a more user-friendly way and increase your conversion rate.
For example, you can use heatmaps on your product pages to see if your landing page is optimized well or not.
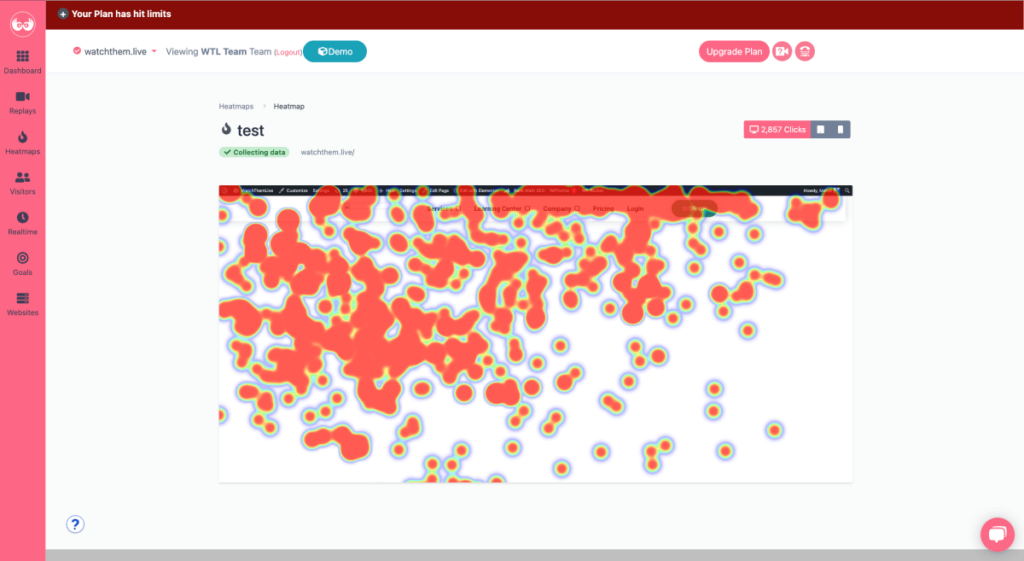

Therefore, make sure you regularly measure your conversion rate and use WatchThemLive to track changes and discover where there might be room for improvement to see whatever you can’t see with your naked eyes. Give it a try and sign up to see invisible cracks in your sales funnel.
2. Customer Health Score
Customer health score helps SaaS businesses see beyond the surface and try to answer the following questions:
- Are their customers healthy or at risk?
- Are they satisfied while using the product?
- How successful are they after purchasing your products or services?
- Have their pain points been eliminated?
This score can help you identify areas where you need to improve or make changes according to your customers’ needs. According to HubSpot Research,
93% of customers are likely to make repeat purchases with companies offering excellent customer service.
Besides the subordinate responsibilities like answering emails and calls, the primary responsibility of customer support is to ensure that customers are satisfied with their purchase decision and return after purchase. They must follow up with customers during their buying journeys and address their problems with the right solutions.
Nowadays, customer success can strongly affect increasing existing revenue. According to online reviews statistics, 98% of consumers read online reviews before making a purchase. Moreover, 72% of customers are willing to share their good experiences with others, as reported by helpscout.
So when you actively foster and track customer success, one customer’s success can instigate another person to try your product or service in hopes of having the same experience.
To calculate a customer health score, you need to take the steps below:
- Segment your customers based on assigning health score
- Determine the customers’ actions
- Assign a score to each of these actions
- Track the number of times a user takes action during a specific time
- Calculate the total action value for each action
- Add all action values
3. Customer Lifetime Value
Customer lifetime value (CLV) refers to the total value a customer is expected to spend during their lifetime as a paying customer. CLV is one of the best ways for businesses to measure and forecast the profitability of their customers and close the loop between customer success efforts and revenue.
Customer lifetime value helps you grow your business by understanding which customers are most valuable. You can also make more informed decisions about allocating your resources to maximize profitability.
An effective customer success team should help your business boost annual revenue per customer and the average length of customer relationship (in years), which are two key performance indicators and create a compound impact on customer lifetime value.
To calculate your average customer lifetime value, you’ll need to know three things:
- Annual revenue per customer,
- The average length of customer relationship (in years),
- Customer acquisition cost (CAC).
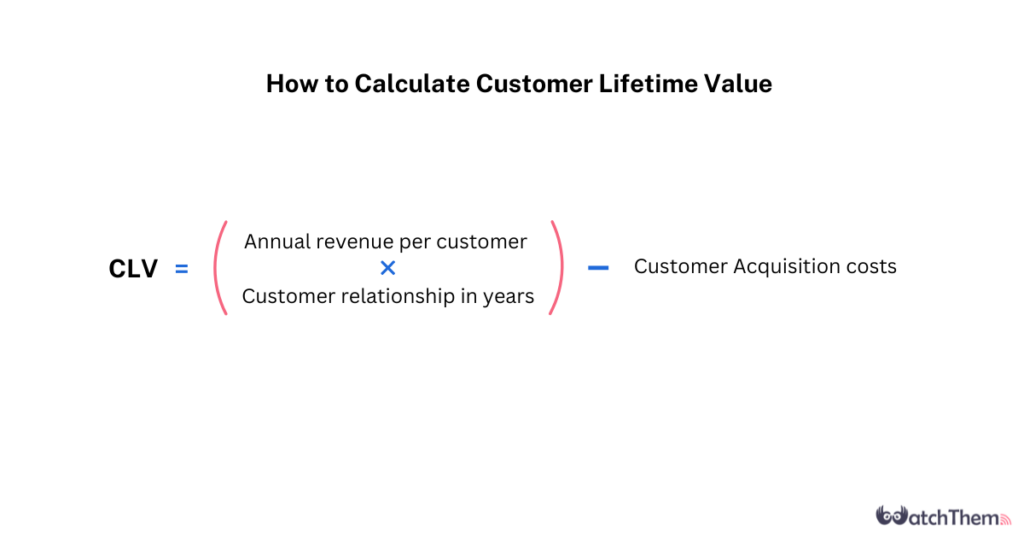

After collecting those data, first, you need to multiply your annual revenue per customer by the customer relationship in years, then subtract your customer acquisition cost. The result is your average customer lifetime value.
4. Customer Retention Cost
Customer retention cost is another customer success metric that helps you measure how much it costs to keep a customer over time.
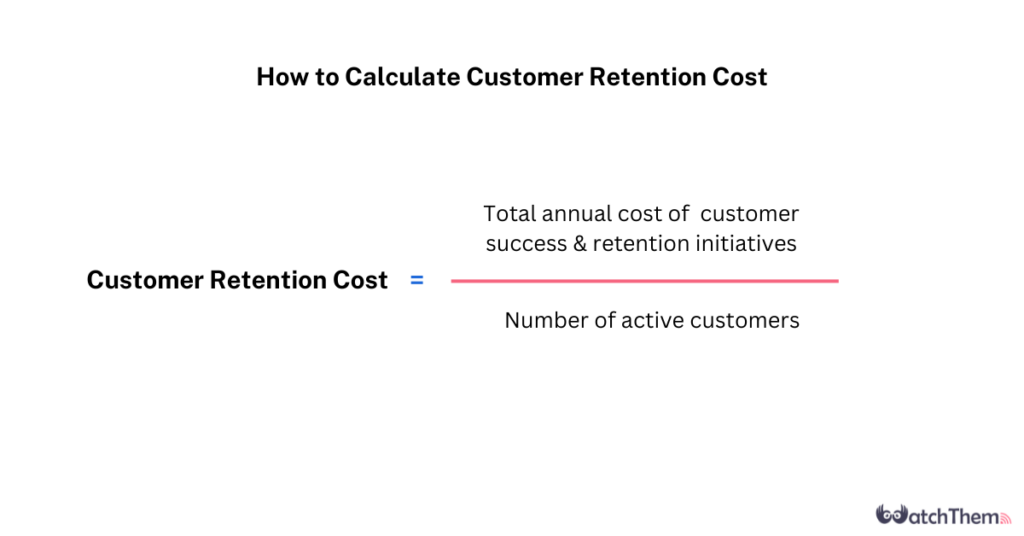
To calculate customer retention cost, you’ll need two pieces of data:
- The total annual cost of your customer success and retention teams and initiatives
- The number of current active customers
Then, divide the total annual cost by the number of active customers. The answer (in dollars) is your customer retention cost.

5. Net Promotor Score
This is one of the customer success KPIs used by the customer support team. Net Promotor Score (NPS) is a customer success metric that highly relies on your customer feedback. Your Net Promotor Score is based on customer responses to NPS surveys. It measures customer loyalty and satisfaction and tries to answer this simple question: “How likely are you to recommend (business or product) to a friend?”
The answer is given on a scale of 0-10, with 0 being “not likely” and 10 being “extremely likely.” Based on the responses, customers are divided into three groups:
- Promoters (score 9-10): This group includes loyal customers willing to do business with your company and may also recommend you to their friends and family.
- Passives (score 7-8): Passive customers are satisfied but unenthusiastic customers who may turn into your competitor.
- Detractors (score 0-6): These are unsatisfied customers who could spread negative word-of-mouth about the company and share their poor experiences on social media.
I can’t be a detractor customer, but I highly appreciate their comments when I’m considering a product 🙂
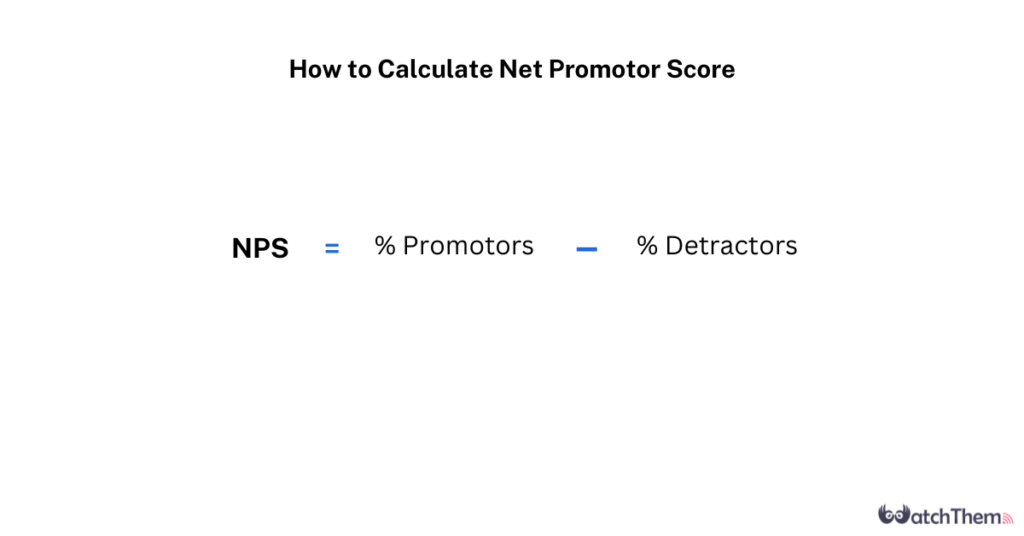
Anyway, Net Promotor Scores change between -100 and +100. You can use NPS surveys of your customers to calculate your Net Promotor Score, which is the difference between the percentage of promotors and the percentage of a detractor. Remember, NPS metrics are expressed as a number, not a percentage.

6. Qualitative Customer Feedback
Another customer success metric to measure is your customers’ feedback. Qualitative feedback enables you to understand what customers are saying about you and how well your company is doing in meeting their needs. You can also realize how successful their journeys are and whether you provide a great customer experience or not.
To improve your UX experience and build a long-lasting relationship with customers, you need to hear the voice of customers, and customers need to feel valued. Sometimes, collecting customers’ feedback may be daunting, but getting a chance for your customers to speak up is better than losing them for real.
To get qualitative customer feedback, you can send out a survey and ask them to answer questions about how they feel about your company, products, and buying experiences.
7. Customer Satisfaction Score
Among all the customer success metrics that we’ve mentioned, this is one of the best indicators of customer success that measures how customers rate their experience with your company’s products or services. Similar to NPS, you can get customer satisfaction scores through customers’ feedback instead of the company’s internal data.
A high CSAT score indicates that you fulfill customers’ needs and wants and that they are satisfied with what they’ve purchased. A low CSAT score can be dangerous for your company and indicate something is wrong with the product or service.
To calculate your customer satisfaction score, take the steps below:
- Pose questions you want to ask customers.
- Think about your rating scale (try to choose a simple one: good/bad/neutral).
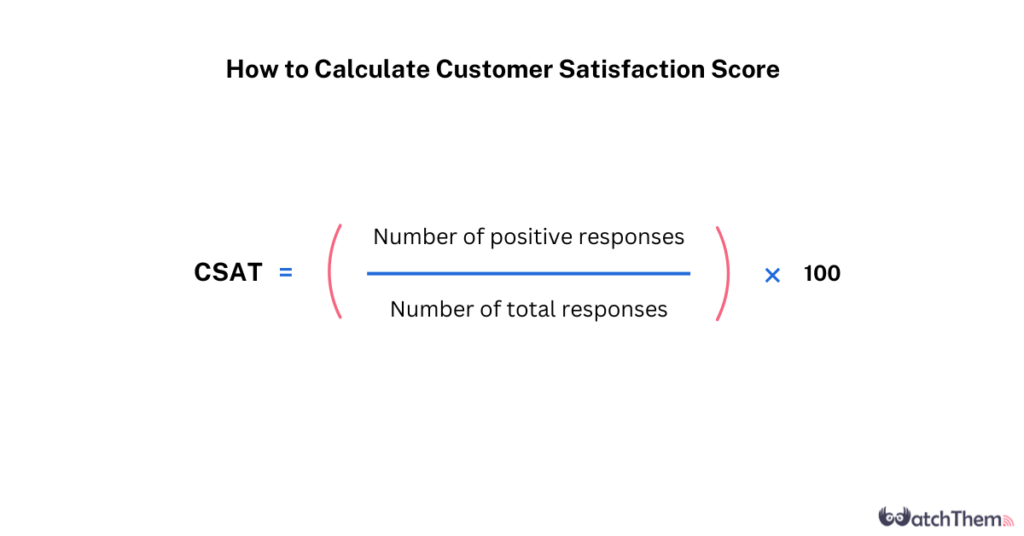
Finally, you can divide the number of positive responses by the total number of responses, then multiply by 100 to get a percentage.

8. Repeat Purchase Rate
A repeat purchase rate is a customer success metric that measures the percentage of customers who purchase your product again. This metric is important because it shows how successful and satisfied your customers are, and whether they are willing to make repeat purchases.
You need two numbers on hand to calculate your repeat purchase rate:
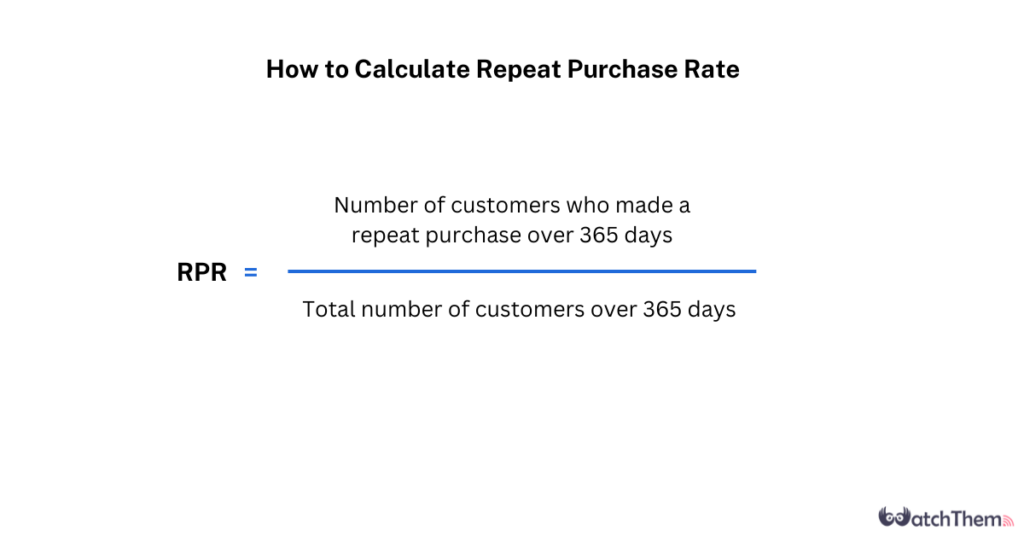
- The number of repeat customers
- Your total number of customers over the same time period
Along with repeat purchase rates, you can measure those numbers based on annual numbers and any given time period that makes sense for your business.
So divide the number of customers who made a repeat purchase by the total number of customers for your chosen time period to calculate your repeat purchase rate.

9. Customer Retention Rate
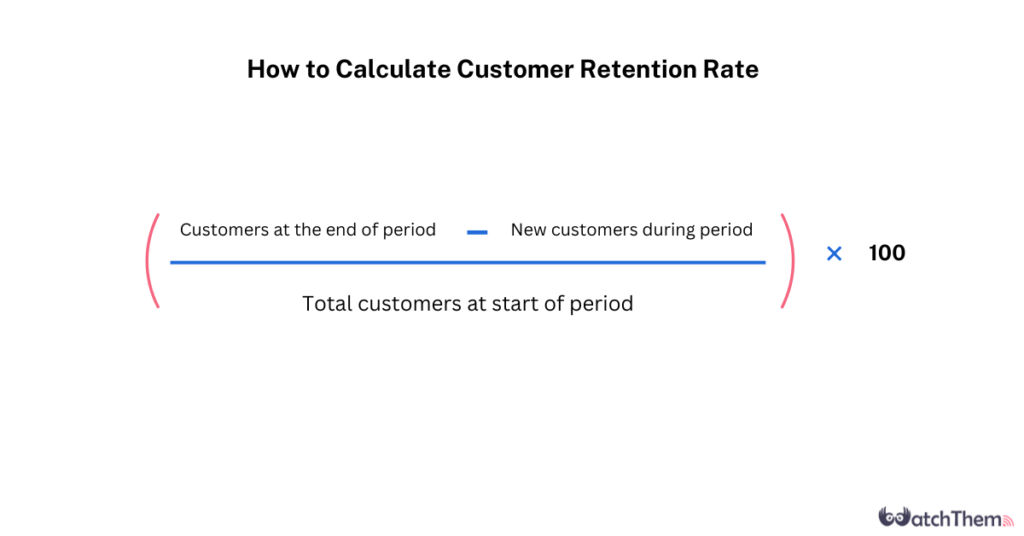
Customer retention rate (CRR) is a key customer success metric that measures the percentage of recurring customers who retain over a given period or remain subscribed to a service or product.
When you have a high customer retention rate, customers will encourage to make a purchase more than once and are unlikely to churn. Compared to the repeat purchase rate, the customer retention rate is the better option for companies with long-lasting customer relationships.
Calculating customer retention rate is relatively simple and only requires three pieces of data:
- The number of customers you had at the beginning of a particular period of time
- The number of customers you had at the end of that period
- The number of new customers you acquired during that period
At that time, you need to subtract the number of new customers you acquired from your total customers at the end of the time period, then divide that number by the number of customers you had at the beginning. Multiply your answer by 100 to get the percentage that is your customer retention rate.
For example, let’s say a company has 200 customers at the beginning of January and 180 customers at the end of January. Their customer retention rate for that month would be ((180-200)/100)*100, or -10%.

10. Customer Effort Score
Customer Effort Score (CES) is a one-question survey that indicates how much effort a customer has to put into using your product or service. The more effort they put in, the less likely they will hang around. A high CES score indicates that customers are delighted with the product/service and require little support, while a low CES score suggests that customers are struggling and may need more assistance.
According to HubSpot Research, up to 81% of customers who had high-effort customer experiences may talk negatively about the company. In comparison, 94% of customers who rated interactions as low effort made a purchase again.
To calculate CES, you need to ask customers to rate their level of satisfaction on a rating scale of 1 (very satisfied) to 7 (very unsatisfied). The scores are then averaged to create the CES score.
11. Customer Churn Rate
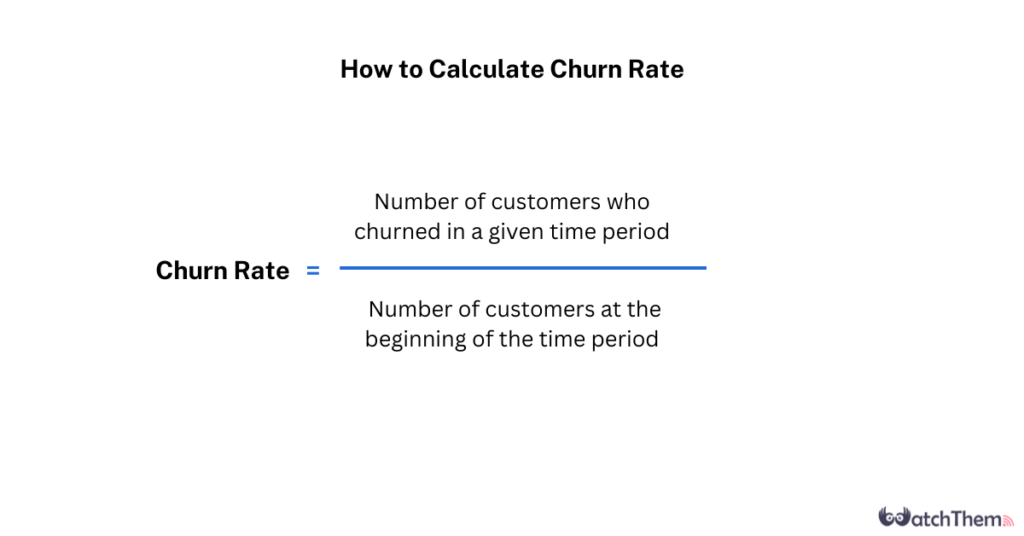
This last customer experience metric quantifies the number of customers or subscribers you lose within a given period (usually a month). It can indicate whether a business is growing or losing customers. A high churn rate may indicate that a business is losing customers faster than it is gaining them, which could lead to financial difficulties and ruin your conversion rate.
After defining a churned customer, you’ll need to know the following:
- How many customers you had at the beginning of the time period (again, this is usually a monthly calculation)
- How many customers churned during the same period
To calculate the churn rate, you need to divide the number of customers who churned by your beginning number, then multiply by 100.

12. Average Revenue Per User
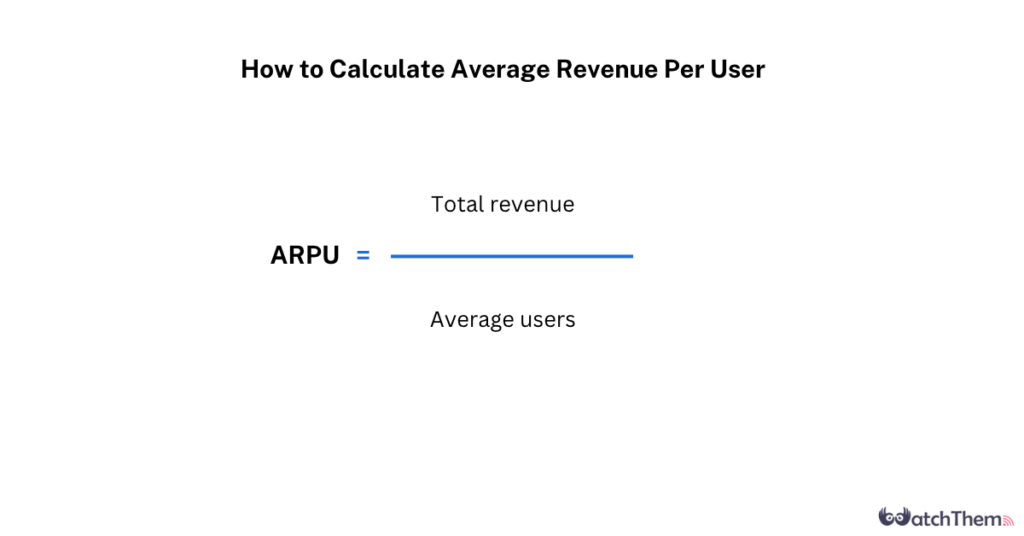
The average revenue per user (ARPU) or average revenue per unit is a metric used by Saas companies to quantify the average revenue received by each user.
ARPU is calculated by taking the total revenue and dividing it by average users during a specific time frame (usually monthly).

Customer Success Metrics FAQs
Now that you have learned how to measure metrics for customer success; it’s time to answer some frequently asked questions:
1- What Is Saas Business?
The SaaS business model has become increasingly popular in recent years, allowing businesses to save on the upfront costs of purchasing and installing software by delivering applications over the internet.
2- What Are the Two Most Important Saas Customer Success Metrics to Track?
There is no definite answer. Surely, you need to put your focus on tracking all metrics to get more meaningful data. But within all Saas customer success metrics, conversion rate and customer retention rate are the important ones.
Conclusion on Essential Customer Success Metrics
As Guy Nirpaz said, ‘customer success is not about support. It’s not about being reactive. It’s about being PROACTIVE’. In this article, we’ve highlighted twelve customer success metrics you need to measure to understand the number of customers satisfied with your company. So you can identify where they encounter problems on their way and uncover issues. Because you can’t monitor every customer’s journey, WatchThemLive can help you see every detail you can’t see with your naked eyes. Make sure to sign up.

