Page Contents
Data professionals work with two types of data: Quantitative and Qualitative. Quantitative data refers to measurable data, and we use numbers, while qualitative data refers to descriptive data, and instead of numbers, we use words.
In this article, we are going to talk about quantitative data in detail and discuss the different types of quantitative data, and the methods to collect it.
Note: For digital marketers, Google Analytics is a common quantitative source. You can also use other analytical tools such as WatchThemLive to know the number of visitors to your website and the percentage of converted leads.
What is quantitative data?
Simply put, quantitative data is all the data that can be counted, measured, or quantified to give the researcher numerical data. Working with quantitative data, we usually bump into questions like “How many? How much? How often?” For instance, a manufacturing company may ask, “How much is the production cost?”
Here are some examples of quantitative data:
- Revenue in dollars
- Weight in kilograms
- Age in months or years
- Length in centimeters
- Distance in kilometers
- Height in feet or inches
- Number of weeks in a year
What Are Quantitative Data Types?


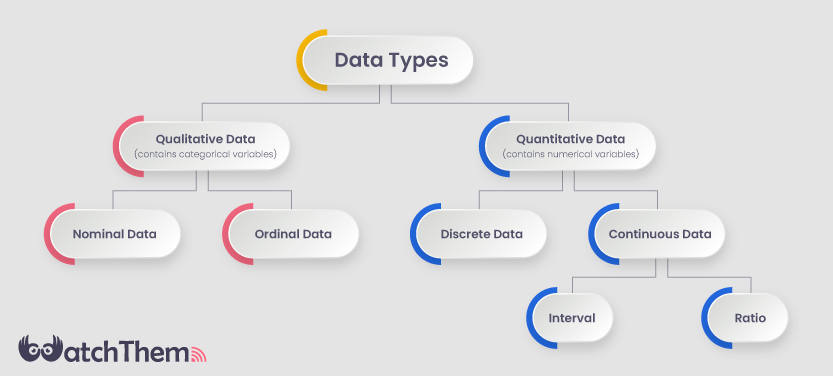
As you can see in the image above, both qualitative data and quantitative data are divided into two types. Here we are going to dive a bit deeper into quantitative data.
Discrete Data
Discrete data is a type of data that is all related to counting numbers, and it is not used to measure things like weight, length, or height. Discrete data is specifically used to measure the number of students, days in a year, people’s ages, etc. To ensure you have identified discrete data, you can ask questions like “can it be counted?” and “can it be divided into smaller parts?”
Discrete data is quantitative data and only takes certain numerical values that cannot be broken down. In other words, when you count something, you get discrete data or a fixed number; for example, you have five siblings, and the number can’t be 5.2. We usually visualize discrete data by tally charts, bar charts, and pie charts.
Continuous Data
Continuous data is a type of data that takes on numeric values that, unlike discrete data, can be broken down into smaller units. Continuous data can measure things like weight, height, and length. We said we could use discrete data for the number of students, but when it comes to the scores of the students, we need continuous data as it includes figures like 18.75, 16.25, and so on.
Continuous data can be also divided into two parts; interval data and ratio data.
Interval data refers to measured data along a continuum where there is an equal distance between each point of the scale, and there is no true zero, like temperature that we have a zero degree, but it just means that it is extremely cold.
Ratio data is the same as interval data in terms of equal distances between each point on the scale, but it has a true zero. For example, when you are talking about the weights, something that weighs zero grams absolutely weighs nothing.
How Is Quantitative Data Different from Qualitative Data?


Generally speaking, quantitative data deals with numbers and any other measurable thing. In contrast, qualitative data is concerned with descriptive data and is aimed to add context to your business analysis. Let’s take a quick look at the table below.
| No. | Quantitative Data | Qualitative Data |
| 1 | Deals with quantities, values, and numbers | Deals with quality |
| 2 | Generalizable | Non-generalizable |
| 3 | Measurable | Not measurable |
| 4 | Structured | Unstructured |
| 5 | Objective in nature | Subjective in nature |
| 6 | Lacks context and detail | Rich in context and detail |
| 7 | Used in a non-probability-based sample size | Used in a probability-based sample size |
| 8 | Answers: “How many? How often? When? what?” | Answers: “Why? How?” |
| 9 | More reliable and objective as it uses statistics | Less reliable due to lack of statistics |
| 10 | A large number of representative samples | A small number of non-representative samples |
| 11 | Faster data collection and analysis | More time-consuming to collect and analyze data |
How to Collect Quantitative Data?
Now that we know what quantitative data is, we are going to discuss the ways of collecting quantitative data. You can collect data in different ways.
1. Survey/ Questionnaire
Utilizing surveys/questionnaires can significantly help in collecting data from a large group of people. It is an ideal way of data collecting for both quantitative and qualitative, but due to the quantitative nature of most surveys or questionnaires (as they must include checklists and rating scale types, and multiple choice questions), this method is basically used in quantitative data collection.
2. Analytics Tools
Different tools can assist you through the process of quantitative data collection. Website analytics, for example, can gather applicable data to your website, and at a glance, you can see metrics such as the traffic you got in a week, page views per minute, the average session length, and lots of useful insights to optimize your performance. Give WatchThemLive a try to have access to all the mentioned metrics plus the superior feature it has over GA, which is gathering qualitative data through session replays. Session replay software allows you to watch the whole customer journey and see where they face any issue. For example, you can see what was their last interaction before getting frustrated and leaving your website for competitors. Want session replays? Sign up here and get started.
3. Observation
In an observational research method, the researcher should observe the audience as an observer or as a participant. It is a basic method in which the researcher has to blend in with their environment. The researcher should collect the quantitative data visually depending on their keen observation. Additionally, in this method, the participants are not put in an awkward situation if they are not really happy to participate.
4. Sampling
Sampling is when the researcher selects a sample or action of the data instead of the entire dataset. This method is much more efficient in terms of saving time and money, especially in cases where not possible to study the entire population. For instance, if you need data from an entire city, it is quite impossible to collect data from every individual; instead, you would analyze a representative sample. There are two types of sampling:
1. Random Probability Sampling
It is a kind of sampling where the units within the overall dataset have the same chance of being selected.
2. Non-Random Probability Sampling
It is another kind of sampling where, unlike random probability, the researcher actively selects and analyzes the data.
5. Interviews
Interviewing people is a structured and standard method of data collection. In interviews, the researchers only ask a set of pre-written questions and nothing more than that. Different methods of interviews are as the following:
1. Telephone Interviews
Telephone interviews are one of the oldest methods of data collection. However, with the rise of technology and public access to video calls, interviewing people by applications such as Skype has become more popular.
2. Face-to-Face Interviews
Collecting data directly from people helps acquire quality data since it provides a scope to ask detailed questions and gain rich and informative data. Although face-to-face interviews can be time-consuming and more expensive, they still provide higher response rates.
3. Computer-Assisted Personal Interviewing
This method is literally the same as the previous method, and the only difference is that the interviewer doesn’t need to carry papers and questionnaires, a laptop device would be all. It helps with the time you are supposed to spend as you upload the data from the interview directly into your database.
6. Existing Data
Existing data refers to data acquired from secondary sources rather than from original data collection efforts. In other words, this information was not collected during the course of the present evaluation, but instead for other purposes. The researcher can simply add new information to the existing documents.
To analyze existing data and establish new quantitative data you can use research journals and survey records tools.
7. Probability
Probability sampling means that members of the population have an equal chance of being selected. Probability is mainly used in quantitative research. The data is collected randomly and it disrupts any possibility of bias. If you want to produce results that are representative of the whole population, probability sampling techniques are the most valid choice. Different research methods are used to collect quantitative data.
1. Simple Random Sampling
Members of the population are selected randomly. It simply means that every member has a chance of selection.
2. Systematic Sampling
In systematic sampling, type members are chosen at a set interval. It means that the researcher selects the population systematically, for example, every 5th or 10th person from the list.
3. Stratified Sampling
In this sampling method, the researcher divides a population into units to create a sample. For example, the researcher selects a set of males or females in the model using a stratified sampling method.
Conclusion
In this article, we have discussed what quantitative data is, the most popular ways of collecting it, and the differences between quantitative and qualitative data in detail. We have come to the conclusion that quantitative data is the most widely used data type in research, due to its ease of computation with most statistical analysis methods.
A quick run-through of what we discussed:
- Quantitative data is data that can be counted, measured, given a numerical value to, or be quantified.
- Quantitative data can be discrete or continuous. Discrete data takes no fixed values; in contrast, continuous data can be infinitely broken down into smaller parts.
- Quantitative data is easy and quick to collect and is analyzed subjectively.
- Quantitative data is not descriptive and it makes it a bit difficult to make decisions based on the collected information.
- The results in quantitative data are totally dependent on the question types, and a few different questions can make significant changes in the result.
We strongly recommend WatchThemLive as you can use its different features such as analytics, heatmaps, session replays, etc. Sign up now and track your users in every possible way!

