
Page Contents
Last updated: November 2026
Conversion rate vs CTR comes down to timing: click-through rate (CTR) and conversion rate (CR) measure two different moments of the same journey. CTR tells you how many people who saw your ad, search result or email clicked it. Conversion rate tells you how many of the people who arrived did what you wanted. A campaign can win on one and lose on the other, so the useful question is not “which is more important” but “which one is limiting my results right now”.
Conversion Rate vs CTR in One Table
| Aspect | Click-through rate | Conversion rate |
|---|---|---|
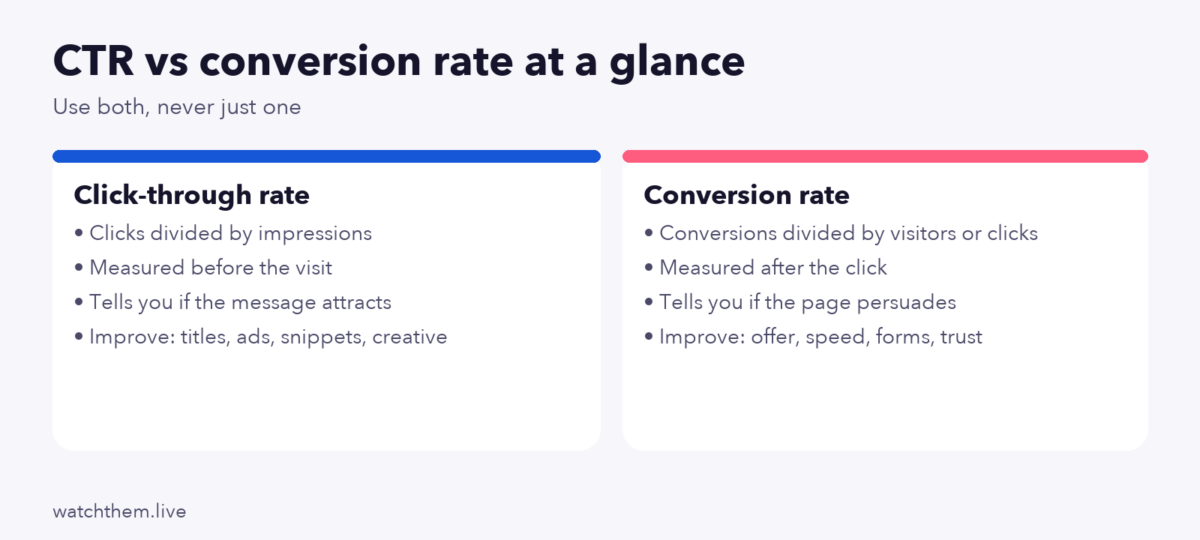
| Formula | Clicks ÷ impressions × 100 | Conversions ÷ visitors (or clicks, sessions, users) × 100 |
| Funnel stage | Before the visit | After the visit |
| Main question | Does the message earn attention? | Does the page or product earn action? |
| Where it is measured | Ad platforms, Search Console, email tools | Analytics, store, CRM, ad platforms |
| What improves it | Titles, creative, relevance, targeting, position | Offer, page clarity, speed, trust, forms, price |
| What it cannot tell you | Whether the visit was valuable | Why people did not click in the first place |
What Is Click-Through Rate? The CTR Side of Conversion Rate vs CTR
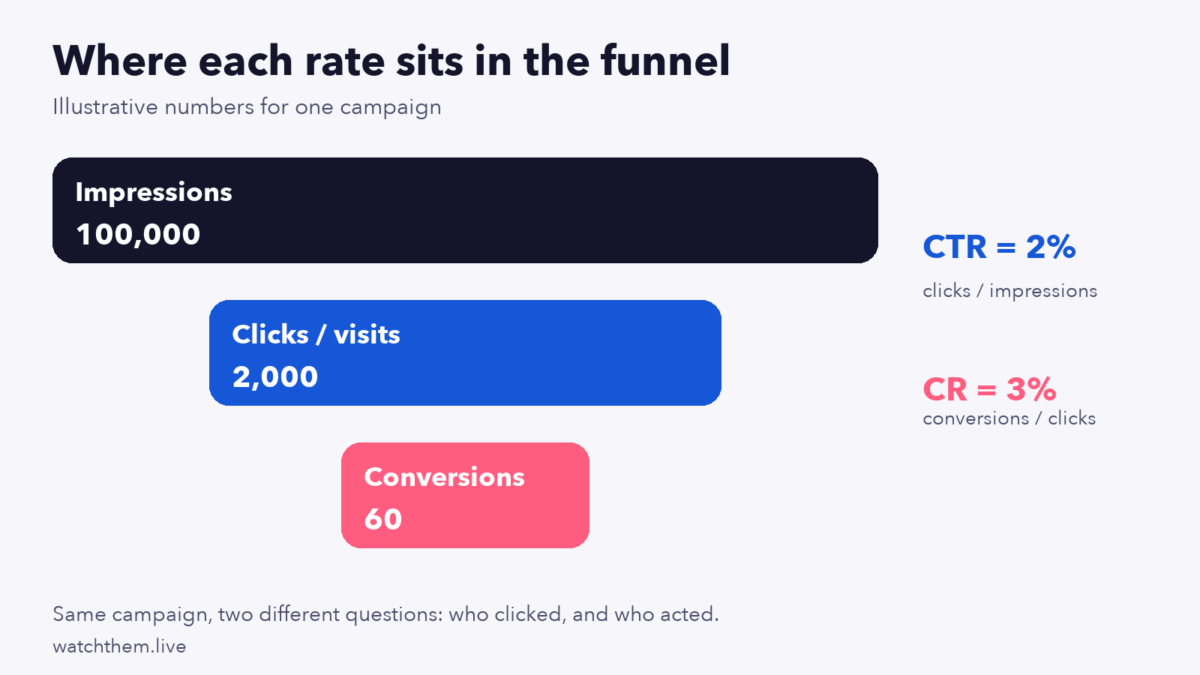
CTR is the percentage of impressions that become clicks. If an ad is shown 100,000 times and receives 2,000 clicks, CTR is 2%. It applies to paid ads, organic search results, emails, push notifications, banners and calls to action inside a page.
Why CTR matters
- It shows relevance. A better match between the query, the message and the audience raises CTR.
- It affects cost. In many ad platforms a stronger CTR improves quality signals, which can lower the price you pay for each click.
- It affects organic traffic. In Search Console a page that ranks well but has a weak CTR has a title or snippet problem.
The trap of a high CTR
A catchy or misleading headline can lift clicks and deliver people who leave at once. If CTR rises but conversions do not, the message promises something the page does not deliver, or it attracts the wrong audience.
What Is Conversion Rate?
Conversion rate is the percentage of visitors who complete a desired action: a purchase, a sign-up, a booking or a form. Ten orders from 500 sessions equal a 2% rate. The denominator can be sessions, users or ad clicks, and the choice changes the number, so state it every time. In GA4, conversions are now called key events, and the main figures are the session key event rate and the user key event rate. Learn the full picture in how conversion rate works and how to measure it.
Why conversion rate matters
- It shows page and offer performance. Traffic only creates value when it converts.
- It lowers acquisition cost. If you double the rate, you pay half as much for each customer from the same traffic.
- It is the base for growth tests. Every optimization program is judged against it.
How the Two Rates Connect: A Worked Example
Take one campaign and follow it through the funnel. The numbers are illustrative.
| Step | Count | Rate |
|---|---|---|
| Impressions | 100,000 | – |
| Clicks | 2,000 | CTR = 2.0% |
| Conversions | 60 | CR = 3.0% of clicks |
| Conversions per impression | 60 in 100,000 | 0.06% |
Total results depend on both rates multiplied together: impressions × CTR × CR. Raising CTR by 25% (to 2.5%) gives 75 conversions. Raising CR by 25% (to 3.75%) gives the same 75. Which one is cheaper to improve decides where you should work first.
Conversion Rate vs CTR: Which One Should You Optimize First?
Read the two numbers together. The table shows the four combinations and what each usually means.
| CTR | Conversion rate | Likely situation | What to do |
|---|---|---|---|
| High | High | Message, audience and page work together | Scale carefully and keep testing |
| High | Low | Message attracts, page fails or promise is off | Match message and page, fix friction, check audience quality |
| Low | High | Few people click but those who do are well matched | Improve titles, creative and targeting to bring more of them |
| Low | Low | Weak relevance across the whole path | Revisit audience, offer and keywords before spending more |
Benchmarks: What Are Typical CTR and Conversion Rates?
Benchmarks vary by channel, industry and year, so use them as a loose reference. Search Engine Journal’s coverage of the WordStream and LocaliQ data reported an average search ad CTR of about 6.66% and a conversion rate of about 7.52% for 2025, and secondary summaries of the 2026 report cite about 6.64% CTR and 8.18% conversion rate. Landing pages across industries had a median conversion rate of about 6.6% in Unbounce’s 2024 report. E-commerce overall is often quoted near 2% to 3%. For a deeper look, see what a good conversion rate looks like by industry.
Where to Measure Each Rate
| Source | Metric you get | Tip |
|---|---|---|
| Google Ads and other ad platforms | Impressions, clicks, CTR, conversions, conversion rate | Conversion rate in ad platforms usually uses clicks or interactions as the denominator |
| Search Console | Impressions, clicks and CTR for organic results by query and page | Sort by impressions, then look for pages with low CTR |
| GA4 | Sessions, key events, session and user key event rate | Compare by channel, device and landing page |
| Email tools | Open, click and click-to-open rates | Opens are less reliable because of privacy features |
| Behavior tools | Click maps, scroll depth, recordings | Show why clicks do not become conversions |
Behavior tools bridge the gap between the two rates. Session recordings of real visitors show what happens after the click, and the article on landing page metrics worth tracking explains the supporting numbers.
How to Improve Click-Through Rate
- Write a clear, specific headline. Include the benefit, and the main keyword where it fits.
- Match search intent. A result that answers the exact query gets the click.
- Use strong creative and relevant extensions or snippets. Add numbers, proof and a clear next step.
- Target better. Narrow audiences and negative keywords remove clicks that never convert.
- Test variations. Compare titles, descriptions and images one at a time.
- Improve position. Higher placements get more clicks, so relevance and quality both matter.
How to Improve Conversion Rate
- Keep message match. Repeat the promise of the ad or snippet on the page.
- Speed up the page, particularly on mobile.
- Make the next step obvious. One main action, clear button text.
- Cut friction. Shorter forms, guest checkout, early cost clarity.
- Add proof near decisions. Reviews, guarantees, secure payment cues.
- Test and learn. Use a structured process, for example CRO testing methods and tools and landing page ideas to test.
CTR Across Channels
| Channel | How CTR is counted | What drives it |
|---|---|---|
| Search ads | Ad clicks ÷ ad impressions | Keyword match, headline, ad extensions, position |
| Organic search | Clicks ÷ impressions in Search Console | Ranking position, title, description, rich results |
| Clicks ÷ delivered emails, or clicks ÷ opens | Subject, relevance, one clear link, timing | |
| Social ads | Link clicks ÷ impressions | Creative, audience, first line, offer |
| Display banners | Clicks ÷ impressions | Placement, creative, targeting; usually the lowest rates |
| On-page buttons and links | Clicks ÷ views of the element | Position, contrast, wording, surrounding content |
CTR differs enough between channels that comparing a search ad with a display banner tells you little. Compare each channel with its own past results.
Measurement Caveats You Should Know
- Attribution windows. A conversion can occur days after the click. Ad platforms and analytics may assign it differently, so totals rarely match exactly.
- Click is not a visit. Ad clicks include accidental taps, bots and visitors who leave before the page loads, so conversions per click will be lower than conversions per session.
- Consent and privacy. When cookie consent blocks analytics, visits and conversions are under-reported, which can make rates look worse or better depending on who declines.
- Tiny samples. A CTR of 10% from 40 impressions means little. Wait for enough data before drawing conclusions.
A Quick Decision Guide
- If you are paying for clicks and your cost per acquisition is too high, check the conversion rate on the landing page first, since fixing it lifts every campaign at once.
- If your landing page converts well but volume is low, work on CTR and reach with better titles, creative and targeting.
- If organic traffic is flat while rankings are fine, test titles and descriptions to raise CTR in Search Console.
- If both rates are weak, step back to the offer and audience before touching details.
Related Metrics to Read Alongside CTR and CR
- Cost per click (CPC): what each click costs. A higher CTR often helps reduce it.
- Cost per acquisition (CPA): total spend divided by conversions. It combines CTR, CR and CPC into one number.
- Engagement rate and bounce rate: in GA4, an engaged session lasts over 10 seconds, has a key event or has two or more views, and bounce rate is 100% minus the engagement rate.
- Revenue per visitor: shows value, not just counts.
- Funnel step rates: reveal which step loses people. See funnel analysis to find drop-off steps.
More supporting numbers appear in website metrics that matter for growth.
Common Mistakes When Comparing the Two
- Optimizing CTR alone. It can attract the wrong people and raise costs per sale.
- Mixing denominators. Compare conversion rates only when they use the same base.
- Ignoring segments. Device, source and audience change both rates.
- Calling a test too early. Small samples make both rates jump.
- Forgetting attribution lag. Conversions can arrive days after the click, so recent campaigns look worse than they are.


Frequently Asked Questions About Conversion Rate and CTR
What is the difference between CTR and conversion rate?
CTR is clicks divided by impressions, measured before the visit. Conversion rate is conversions divided by visitors or clicks, measured after the visit.
Which is more important, CTR or conversion rate?
Neither alone. Total results come from both, so improve the weaker link first and judge changes by revenue or cost per acquisition.
Can I have a high CTR and a low conversion rate?
Yes. It often means a mismatch between the message and the page, the wrong audience or friction after the click.
What is a good CTR?
It depends on channel and position. Secondary reports of search ad data put averages near 6% to 7% in recent years, but organic and email rates differ widely.
What is a good conversion rate?
About 2% to 5% is a common general range, higher for focused landing pages and paid search. Compare against your own history first.
How do I calculate both rates?
CTR = clicks ÷ impressions × 100. Conversion rate = conversions ÷ visitors (or clicks) × 100.
Conclusion
In the conversion rate vs CTR comparison, the two answer different questions: CTR tells you whether your message earns the click, and conversion rate tells you whether the visit earns the action. Read them together, use the four-case table to decide where to focus and keep message and page aligned. Then measure by segment, test one change at a time and judge results by cost per acquisition and revenue, not by a single percentage.
