Page Contents
Google Analytics is one of the most powerful analytics tools that almost every website owner uses to analyze different aspects of their domains. However, using it is not without difficulties. One question users might face when navigating this tool is ‘What report indicates where users start or exit the conversion funnel?’.
Having a successful website requires designing a straightforward conversion funnel that allows users to move seamlessly from the initial interaction to the desired goal, such as making a purchase or filling out a form. Google Analytics provides valuable insights into this process through various reports, and one of them specifically indicates where users start or exit the conversion funnel. But, which one?
That’s our topic today! Whether you’re thinking of taking the Google Analytics Individuals Qualification exam, or want to keep track of your progress, knowing the answer is critical. So, keep reading this article to find your answer!
What Is a Conversion Funnel
If you’re wondering, ‘What report indicates where users start or exit the conversion funnel?’ then you must first understand what a conversion funnel is.
A conversion funnel is a marketing and sales concept that represents the journey a potential customer takes from the initial awareness stage to making a desired action or conversion, such as a purchase or sign-up. The term ‘funnel’ is used to describe the gradual narrowing of potential customers as they move through various stages of the buying process.
The typical stages in a conversion funnel include:
- Awareness: This is the stage where potential customers first become aware of a product, service, or brand. It could involve exposure through advertising, social media, content marketing, or other channels.
- Interest: In this stage, individuals show an active interest in the product or service. They may seek more information, engage with content, or explore specific features and benefits.
- Consideration: At this point, potential customers are seriously considering the product or service. They might compare it with alternatives, read reviews, and evaluate the value it offers.
- Purchase/Conversion: This is the final stage where the actual transaction or conversion takes place. The individual becomes a customer by making a purchase, signing up for a subscription, or completing the desired action.
- Post-Purchase Evaluation and Advocacy: After the conversion, the customer evaluates their experience with the product or service. Positive experiences can lead to customer advocacy, where satisfied customers recommend the product to others.
Creating a conversion funnel helps businesses analyze and optimize the customer journey to improve conversion rates. Marketers use various strategies and tactics at each stage to guide potential customers through the funnel and increase the likelihood of conversion.
Also Read: How to Set Up Conversion Funnels in Google Analytics
Now, let’s answer some serious questions.
What Report Indicates Where Users Start or Exit the Conversion Funnel?
The report that indicates where users start or exit the conversion funnel is the ‘Goal Flow‘ report. This report allows you to visualize the path users take through a defined set of goals or steps on your website. It helps you understand how users move from one step to another and where they enter or exit the conversion process.
In order to access the Goal Flow report in Google Analytics, follow these steps:
- Log in to your Google Analytics account.
- Navigate to the specific view or property for which you want to analyze goal flows.
- In the left-hand menu, click on ‘Reports.’
- Under the ‘Conversions’ section, select ‘Goals.’
- Click on ‘Goal Flow.’
In the Goal Flow report, you’ll see a visual representation of the steps in your conversion process. Analyzing this report allows you to identify where users typically enter the funnel and at which steps they may drop off or exit the conversion process. This information helps you optimize your website and improve the user experience to maximize conversions.
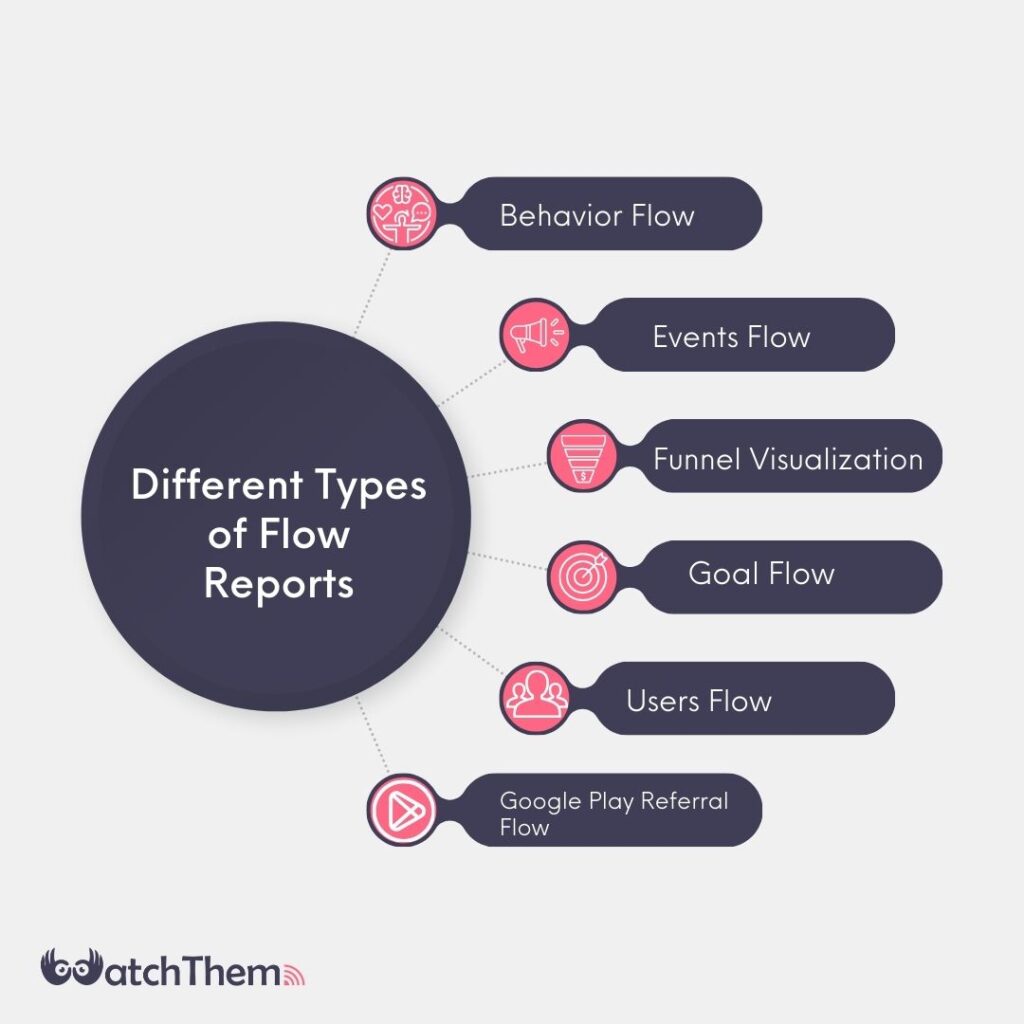
Different Types of Flow Reports
Now that you know what report indicates where users start or exit the conversion funnel, it’s important you get familiar with other types of flow reports. By understanding their patterns and insights, you can optimize your website or application to enhance user experience and achieve your business goals.
So without further ado, here are some additional types of flow reports that provide valuable information:


#1 Behavior Flow
Behavior Flow is another insightful report in Google Analytics that provides data on how users navigate through your site and move from one page or event to another. Unlike the Goal Flow report, which specifically focuses on the steps leading to a conversion, the Behavior Flow report illustrates the general paths users take on your website.
This Flow report showcases the flow of user interactions, and it helps you identify popular pages, the sequence of user actions, and potential pain points. It can also help you identify any issues your content might have that interfere with the user journey. The Behavioral Flow report displays different elements such as events, pages, and content groupings.
#2 Events Flow
If you want data on users who trigger events, the Events Flow report is your solution. In Google Analytics, an “event” is a user interaction with content that is tracked separately from pageviews. Events can include various actions such as clicks on buttons, downloads of files, video views, form submissions, and more.
Events Flow report offers a deep insight into users’ interactions with different elements of your website. This way, you can identify any possible issues, and discover new areas for improvement.
#3 Goal Flow
As we mentioned earlier, the Goal Flow report shows the path your users take through your conversion funnel, and whether their journey is performing as expected. This report allows you to see whether there are any loops or drop-offs, and if the users are seamlessly reaching the end of the conversion funnel.
#4 Users Flow
Users Flow provides insights into the journey users take on your website. It allows you to compare traffic volumes from various sources. As a result, you can understand the effectiveness of different marketing channels in directing users to your site. Users Flow report not only quantifies the volume of traffic but also delves into the sources of this traffic, helping you identify which channels are driving visitors to your site.
#5 Google Play Referral Flow
The Google Play Referral Flow report is a crucial tool for app developers and marketers seeking to understand the dynamics of user acquisition and engagement on the Google Play Store.
This flow report is particularly valuable for those managing mobile applications, offering insights into the volume of traffic that flows through each stage of the acquisition process.
One of the primary advantages of the Google Play Referral Flow report is its ability to reveal what content users find interesting throughout the acquisition process. It provides a comprehensive view of the stages users go through, from discovering the app to clicking on the listing, and ultimately, installing it.
#6 Funnel Visualization
This report gives an overview of the performance of goal conversion funnels on a website or app. Unlike the Goal Flow report, it doesn’t show the specific paths users take but focuses on the number of entrances and exits at each funnel step.
This report helps identify drop-offs in the conversion process, allowing for a quick assessment of overall goal performance. For a deeper analysis of potential issues revealed by the Funnel Visualization report, users can turn to the Goal Flow report, which provides a more detailed understanding of user paths and behavior.
People Also Ask: what report indicates where users start or exit the conversion funnel?
In this guide, we answer crucial questions such as ‘What report indicates where users start or exit the conversion funnel?’ However, you might still have some questions left. So, before finishing up, we’re going to go over some FAQs:
Q1. How Does a Conversion Funnel Work?
A conversion funnel is a marketing model that illustrates the stages a potential customer goes through before making a purchase or taking a desired action. The stages are awareness, interest, consideration, conversion, and loyalty.
Q2. What Is a Flow Report?
A Flow Report refers to various reports that visually represent the user flow or path through different stages or interactions on a website or application. These reports help businesses and website owners understand how users navigate through their online properties, identify popular paths, and pinpoint potential issues or drop-offs in the user journey.
What Report Indicates Where Users Start or Exit the Conversion Funnel?: Conclusion
Understanding where users start or exit the conversion funnel is crucial for optimizing your website and improving the overall user experience. The ‘Goal Flow’ provides a visual representation of user journeys through defined goals or steps.
Make sure to leverage the insights provided by Google Analytics, make informed decisions, address user pain points, and create a seamless journey for potential customers from awareness to conversion!

