Page Contents
Analyzing customer behavior and what affects it is an important step in optimizing your conversions. Google Analytics allows you to measure goal conversions and create conversion funnels in order to understand the number of clicks an element gets, the number of downloads of your PDF, the number of purchases of a product, etc.
With a conversion funnel, you can find customers’ pain points and remove them as they navigate your website. So, let’s learn what a funnel is, its different types, and how you can build conversion funnels using Google Analytics.
Note: WatchThemLive is a behavior analytics tool that helps you watch your customers’ journey and track goals to improve your funnel conversion rate. Keep reading to see how.
What Is a Funnel in Google Analytics?
A funnel in Google Analytics is a navigational path that you expect users to take before achieving a goal. A funnel consists of a goal page(s) and more funnel stages known as the funnel steps.
Using funnels allow you to define the path from which users enter and exit the conversion funnel. With Google Analytics, you can make up to 20 funnel pages to identify and remove customers’ pain points.
What Is a Goal In Google Analytics?
A goal in Google Analytics is the measurement of completed actions toward your ultimate conversion goal. A goal’s functionality is to determine whether you’re website is going in the right direction, which is improving its conversion rate. Here are some website goal examples:
- Increasing the number of leads
- Increasing the number of app installation
- Improving customer retention
- Increasing newsletters’ subscribers
- Increasing the number of demo requests
Google Analytics has four different types of goals; let’s see what they are and when you can use them.
- URL destination goals: In this type, you will enter a URL, and whenever someone enters that URL, it’ll be counted as an achieved goal. This goal is suitable, for example, for thank-you pages. When a user enters your thank you page, you know that they completed a purchase.
- Visit duration goals: This type tracks the number of people who stay on your website for a specific amount of time. You can use this goal in two ways. For example, you have set four minutes as the time you want people to spend on your website. It will show you both the number of people who stayed on your site for 4 minutes and the number of people who left sooner. This goal is handy for when you’re trying to increase website engagement or time on site. Keep in mind that you have to select a time duration that only some users will spend on your website; if everyone does it, then the goal won’t help you in optimizing your website.
- Pages/Visits goals: This type of goal is more used by customer support websites. With this goal, you can track how many pages users visit before leaving your website. Pages/visit goals are used when a business wants to increase engagement by having users visit several pages before they exit the website.
- Events: This is the most complex type of goal. You can use this goal when you want to track the number of button clicks, for example. Before setting an event as a goal, first, you have to set up the event. Then you can choose any event as a goal. Sometimes, you need to implement JavaScript code to the element you want to track.
WatchThemLive is an analytics tool that allows you to track any goal you want easily with its goal tracking feature. To get started with goal tracking, follow these steps:
- Sign up for free and add your website.
- Then click on the goal icon.
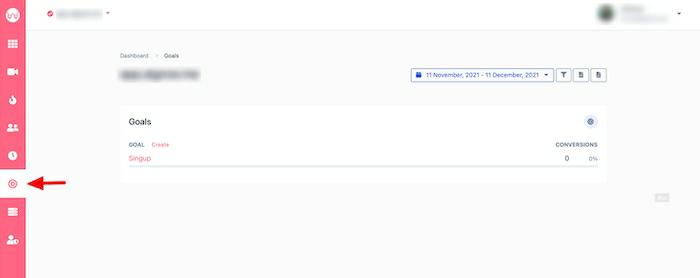

3. Click on the “create” button and create unlimited conversion goals.
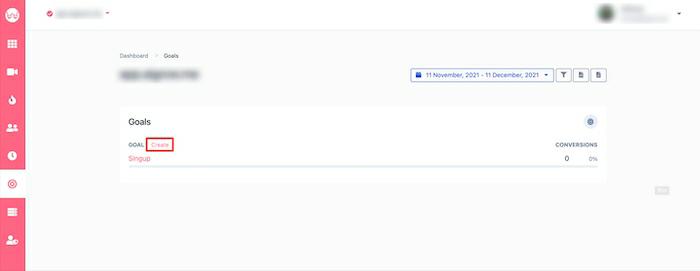

4. If you want to create a pageview goal, name the goal and enter the path of the page. To create a custom event such as sign up, form submission, button clicks, etc., you should select the custom event option and implement the JavaScript code for the element you want to track.
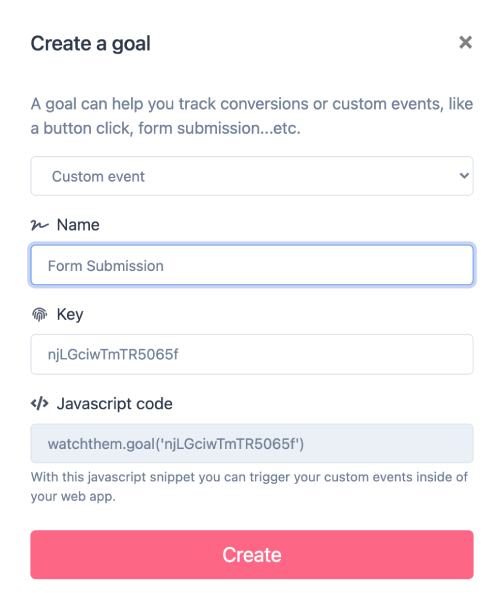

5. Now, WatchThemLive will start tracking your goal.


How to Set Up a Conversion Funnel in Google Analytics
To set up a conversion funnel in Google Analytics, first, you need to choose your goal type.
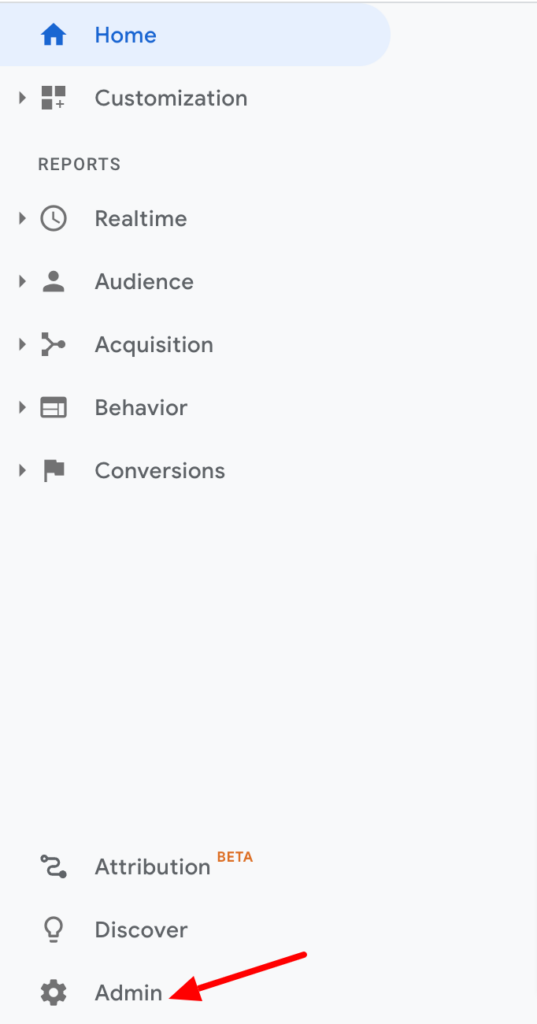
- Open your Google Analytics account and go to the Admin section.

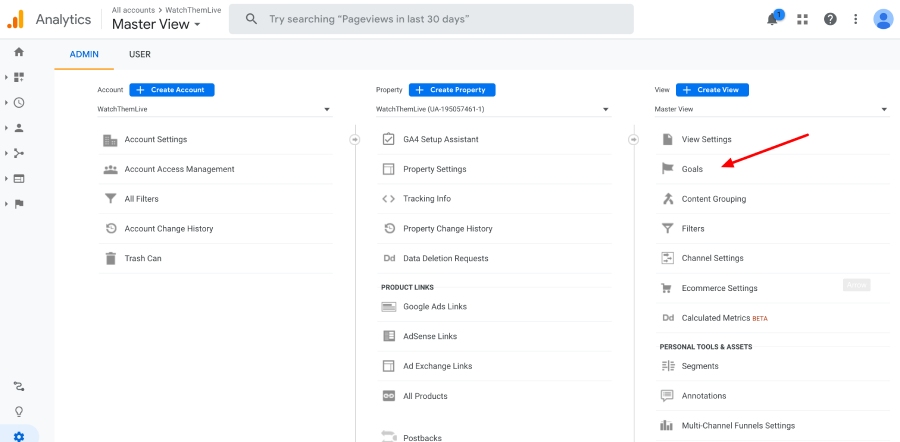
2. You can find the definition of goals in the view section. Then go to the menu item Goal.

3. Click on the “New Goal” button to create a new goal.
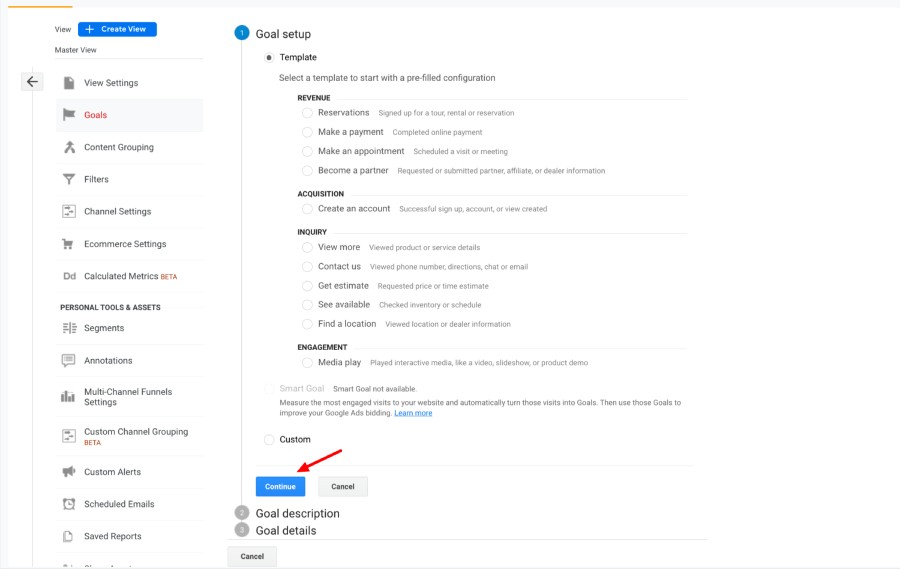
4. Here, you can either choose a goal template or define the goal in a user-defined way. You can choose the template you want, but we’re going to explain “Custom” here.

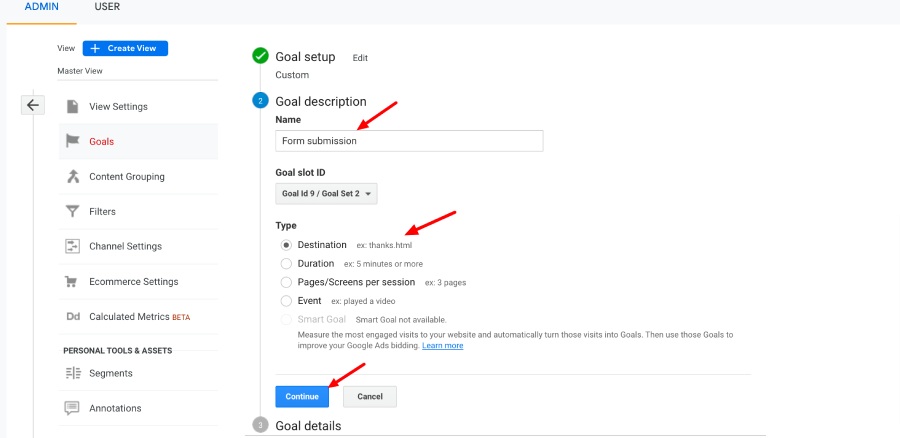
5. In this step, you should define your goal and its attributes:
- Name of the goal: It identifies the goal in your account.
- Goal-Id: It works as a storage location for the data of your goal.
- Type: Here, you should choose your goal type, as we explained earlier.

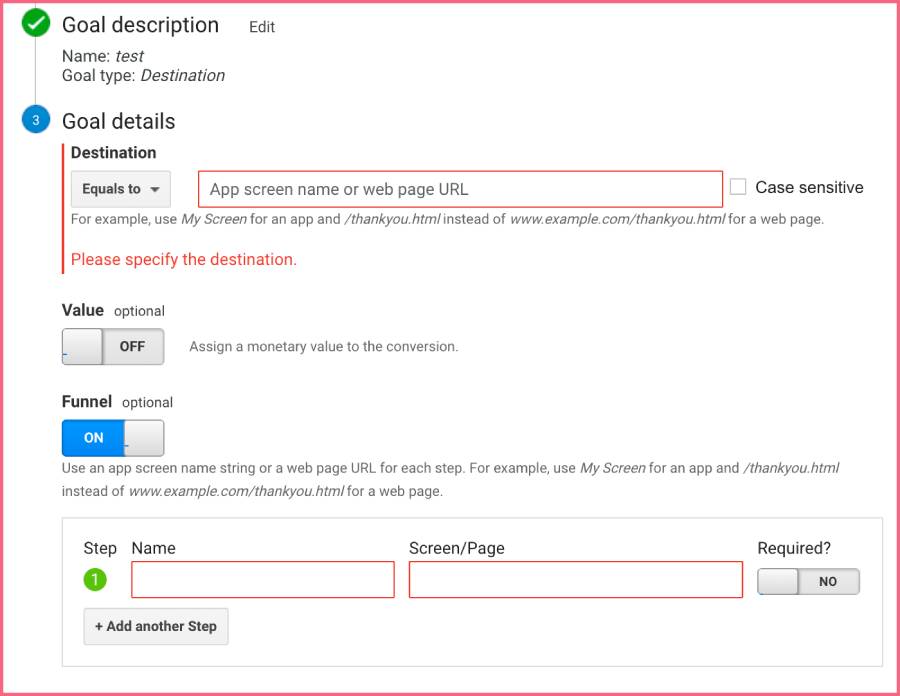
- In the final stage, you have to define the details of the goal.
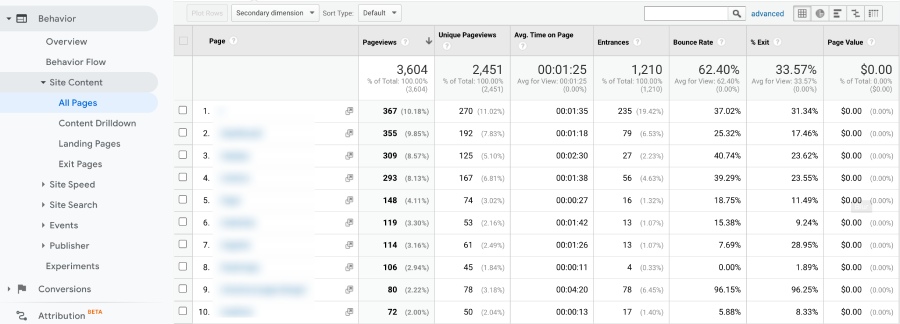
- Goal: It’s the definition of the target page. You can find potential pages for driving conversions if you go to this address:
Behavior>Website content>All pages

- Value: If you want to give your goal a value for reporting purposes, then you have to turn on the Value option.
- Funnel: Here, you can determine the conversion path if you have selected a destination goal.


7. Save the goal, and you’re all done!
Types of Google Analytics Funnels
Google Analytics offers four types of funnels:
- Goal Funnel: This includes the web pages you want your users to complete a non-transactional desired action, such as signing up for a weekly newsletter.
- Sales Funnel: This type includes the web pages you want users to go through in order to complete a transactional goal such as purchasing a product.
- Multi-channel goal funnel: This type allows you to understand how your different marketing channels contributed to the goal.
- Multi-channel sales funnel: This type considers different marketing channels’ roles in the conversion path.
Apart from these four types, there are two other types of Google Analytics funnels:
- Strict funnel: In this type, users have to follow the steps you want them, and they can’t skip any step. Businesses use this funnel to identify the drop-off points.
- Flexible funnel: In this type, users can take any path they like before purchasing a product.
Google Analytics Funnel Visualization Reports
There are six types of Google Analytics funnel visualizations that can help you optimize conversions. Let’s see what they are and how to use them.
1. Goal Funnels
To set a goal funnel, you have to set a goal in Google Analytics and determine the funnel path. Follow this address to do so:
- Admin>Goals>New Goal>Or Choose a Goal
- Go to Destination Goal>Goal Details
- Turn on the Funnel switch
- You can add a URL for each step and name it. You are also able to choose whether a step is strict or flexible.


After you enter all the details, you can see your results under “Conversions.”
2. Checkout Behavior
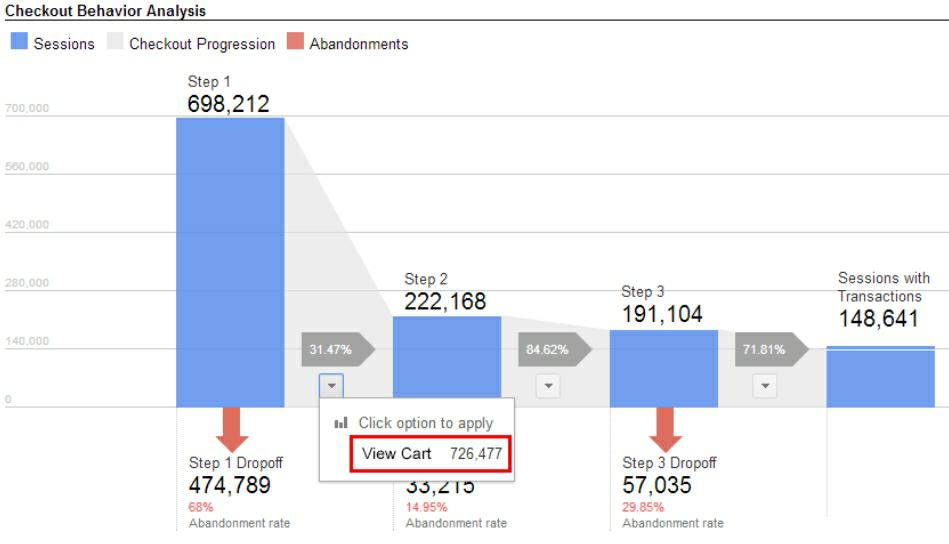
Checkout Behavior, in the Ecommerce section, illustrates where users abandon a checkout process, organized by form field (e.g., email, phone, address, credit card number). You can determine which field is the most annoying for users.
For example, a user may begin the checkout process by entering their email (which isn’t generally a drop-off point) but then abandon the page when it comes to the payment information boxes (which usually is a common drop-off point.)
If that’s the case, you might look into more convenient options like adding a Paypal or one-click purchase button.
Many businesses use a tool named session replay to supervise their customers’ behavior. A session replay is a useful tool that allows you to record users’ interactions with your website. Google Analytics checkout behavior only gives you numerical data, but session replays will give you qualitative data and the reason behind customers’ actions.
In this case, WatchThemLive has the best session replay software. This software allows you to watch every step of the customer journey as well as their checkout behavior. You can watch all of their interactions with your website and see what disturbs them and identify the drop-off points. Session replays are essential for any business, and many great companies use them to know their customers’ wants and expectations. Watch this video to see for yourself:
Sign up and seize their free plan now.
3. Ecommerce Shopping Behavior Report
This funnel is only for eCommerce businesses, and you have to set up eCommerce tracking. You should follow this path to see the data:
Conversions>Ecommerce>Shopping Behavior
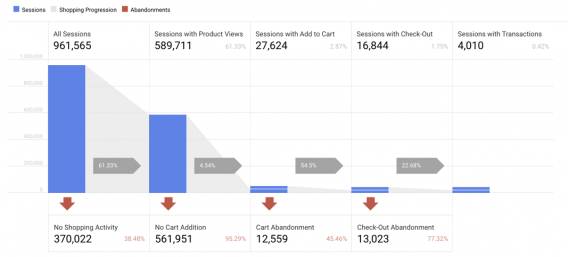
Using this report type, you can see the number of user sessions for each stage of the funnel. It also shows a visual representation of the percentage of visitors who came from the previous step.
You can also narrow your search to specific metrics or pages. For example, you can see how many sessions became transactions by following these steps:
All Sessions > Product Views > Add to Cart > Check-Out > Transactions
Using this funnel, you can find the pages with the highest drop-off rate. You can also discover the product pages with the least visitors and optimize them.
4. Reverse Goal Path Funnels
Reverse goal funnels follow a user’s journey through your site backward, from conversion to the entrance. This distinct pathway discovers common conversion steps and identifies undesirable steps along the way.
Once you’ve established at least one goal, go to:
Conversions > Goals > Reverse Goal Path
You’ll see the number of goal completions as well as the pages that users visited prior to completing that goal.
The Reverse Goal Path tool isn’t the best for identifying common drop-offs. However, it will assist you in determining whether the most common paths are the desired ones. You might discover, for example, that the majority of visitors arrive at a goal via a long-neglected page. You can then devise a strategy for increasing traffic to that page.
5. Horizontal Funnels
Comparing drop-off points by segment is easy with horizontal funnels. As the name implies, funnel steps are visualized horizontally rather than vertically. This funnel tells you the drop-off rate between funnel steps (instead of the completion rate as with soal funnels) and the number of visits for each step.
Since horizontal funnels don’t backfill steps, they are also more accurate than goal funnels. Google explains that a goal funnel visualization “backfills any skipped steps between the entry and exit steps.”
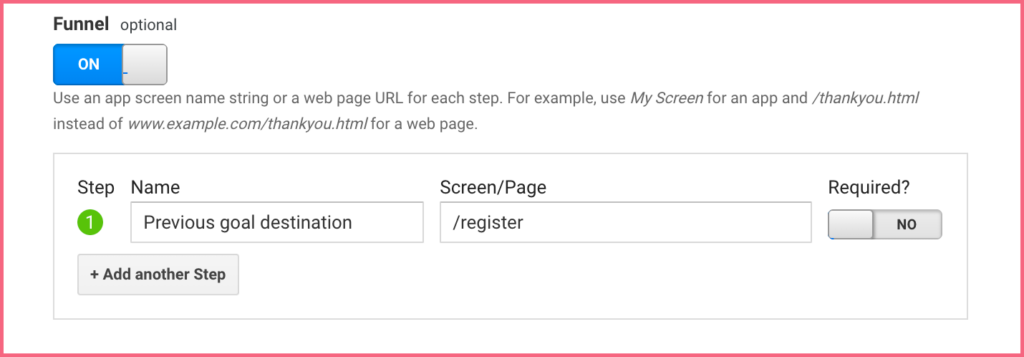
Make a horizontal funnel by setting each step as a goal (like visiting a product page.) After creating your first goal, turn on the Funnel option and add the destination URL of the previous goal as a single step in the funnel.

Then click +New Custom Report under the Customization section of Google Analytics once you have created your goals.
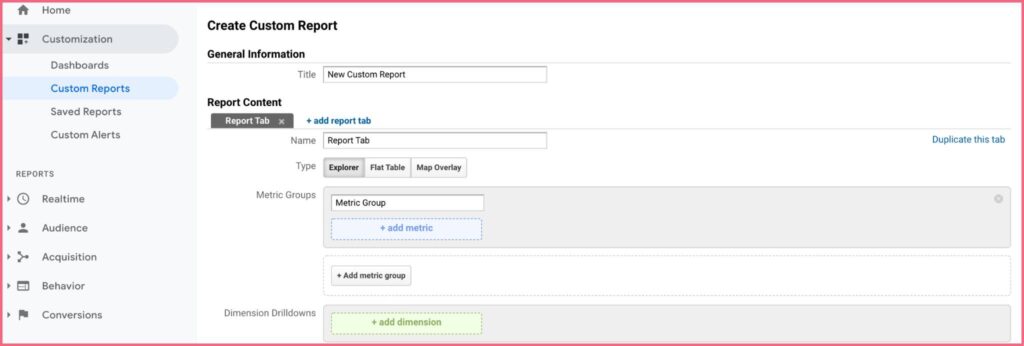

Each goal completion should be listed in chronological order in the Metric Groups section, with the Abandonment Rate metric between each two:
- Goal 1 Completions
- Goal 2 Abandonment Rate
- Goal 2 Completions
- Goal 3 Abandonment Rate
- Goal 3 Completions
When building your custom report, you can sort your data by any custom dimension (landing page, city, browser, etc.) by adding dimensions to the Dimension Drilldowns section:
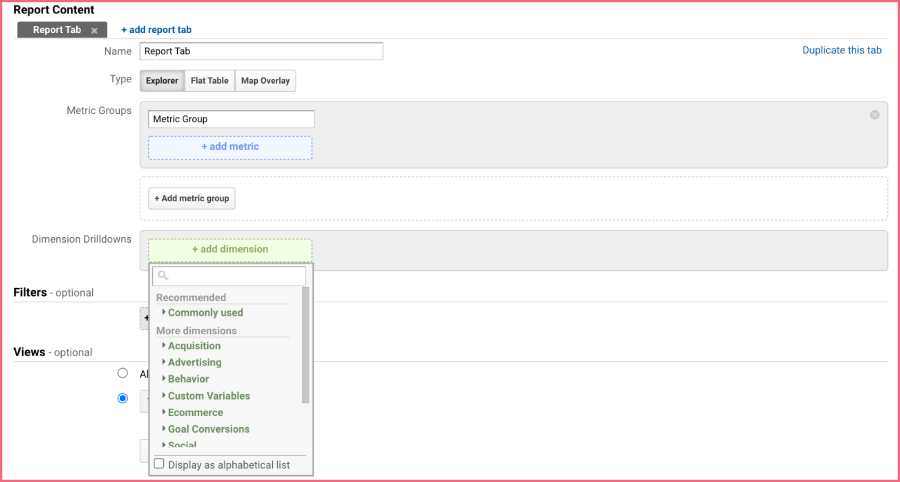

It’s possible to add multiple segments to the same report to see how visitors interact with different parts of your funnel, which isn’t possible with a standard goal funnel.
By identifying segments with one drop-off point, you’ll be able to identify segments that behave similarly except for one drop-off point. This way, you can identify key opportunities for improving the user journey.
6. Custom Funnels
Custom Funnels are exclusively available to Google Analytics 360 users, and they allow you to construct a funnel for any trackable user action or behavior. Pageviews and events, for example, can be used as steps in a funnel—the possibilities are unlimited.
Follow this path to create a custom funnel:
Customization>Custom Reports >New Custom Report
After that, under the “Type” box, choose “Funnel.” You can specify funnel stages by Google Analytics Dimensions, including custom and eCommerce dimensions, in the “Funnel Rules” section below.
This feature lets you track funnels based on specific activities, such as form field filling, which isn’t possible with other funnel reports that rely on URLs. You can use Event Labels, Actions, and/or Conditions to define funnel stages.
Conclusion
Building conversion funnels help you discover customers’ pain points and resolve them. You can also track customer behavior and goals. Google Analytics is a tool that allows you to build your conversion funnel the way you like it. In this article, we taught you how to create a conversion funnel in Google Analytics.
WatchThemLive is a great cost-effective alternative for Google Analytics which offers tools for tracking goals and user behavior. The goal tracking feature allows you to track any goal you want or create custom goals. You can also track user behavior by using session replays and see what disturbs your customer to the point of leaving your website. Sign up and see what’s next!

