Page Contents
A high shopping cart abandonment rate is the death signal for any online business. As shopping cart abandonment statistics demonstrate, failing to convert potential consumers on your site into paying customers is akin to throwing money away.
There isn’t a single internet store that isn’t vulnerable. Even the most well-optimized and well-designed eCommerce stores may lose some sales. This is the main reason for writing our latest article, “shopping cart abandonment solutions.”
However, shopping cart abandonment may be more common than you think, and it could be costing you far more than it should.
The truth is that cart abandonment costs your eCommerce business money. This article explains essential shopping cart abandonment stats and industry benchmarks and how to evaluate them properly.
More articles about marketing tips and strategies


General Shopping Cart Abandonment Statistics
What’s the big deal, you might wonder? So, let’s take a look at the scope of the issue.


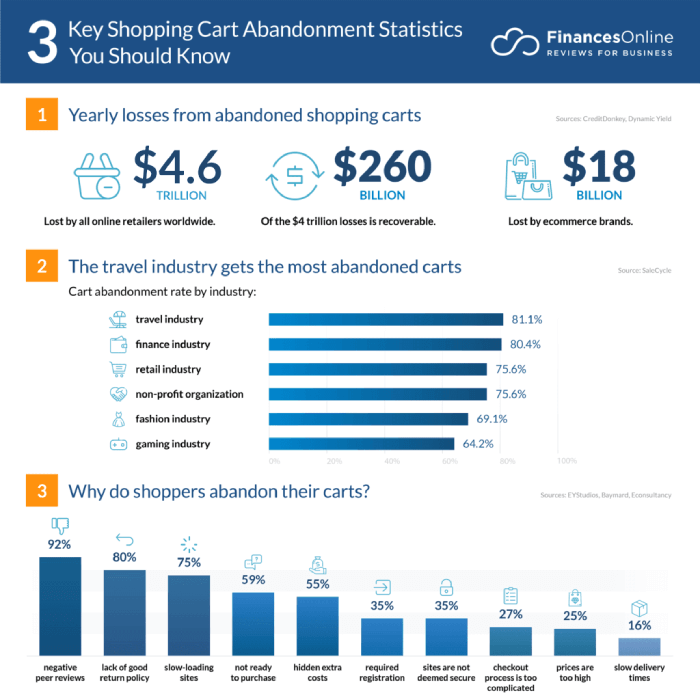
1. Abandoned carts cost e-marketers about 2 to 4 trillion dollars per year.
By any measure, that is a huge sum of money! So, what exactly is an abandoned cart? It’s when a potential buyer exits a webpage without completing the transaction, which is a typical occurrence in eCommerce. The check-out process usually has several steps, and cart abandonment might occur at any of them.
It’s difficult to estimate how much money eCommerce loses due to this problem, but numerous studies have pointed to the necessity to close the revenue gap. We have discussed 10 digital shopping cart abandonment effects in detail if you need more information on this matter.
Source: Annex Cloud
2. The global cart abandonment rate is 75.6%
Almost every new study finds a slightly different cart abandonment rate, with differences attributed to factors such as industry and geography. It’s highly likely most shopping cart abandonment stats in 2022 will fall within this range too.
According to Statista, the average abandonment rate a decade ago was roughly 62 percent.
3. The best-optimized checkout process has an abandonment rate of 20%
It’s worth noting that you won’t be able to entirely eradicate cart abandonment even if you use every conversion rate improvement technique you can think of. But that doesn’t mean you shouldn’t try to keep it to a minimum.
So, what is a satisfactory shopping cart abandonment rate? Experts and shopping cart abandonment statistics say anything in the 30-40% range is notable today.
Source: Wikipedia
4. December has the highest checkout abandonment rate
December, November, and January are when buyers look for Christmas gift ideas and take advantage of Black Friday and January deals. Of course, this is more true for the United States, the United Kingdom, and other western world countries. In fact, it is less accurate for other large eCommerce markets like China and India.
5. Gaming sites are the lowest; finance sites the highest
These results are based on a 75.6 percent global average cart abandonment rate. On gaming sites, 64.2 percent of players abandon new items in their cart. While abandonment on fashion sites is lower than average with 68.3 percent, it is substantially higher in the banking industry with 83.6 percent. This rate is 81.7 percent for travel sites.
Following finance, 83.1 percent of customers leave things in their baskets in the non-profit sector. For retail, the abandonment rate is 72.8 percent, which is similar to the national average.
Source: Smart Insights
6. 99% of new visitors won’t buy on their first visit
Their purchase is usually completed through several visits. Shopping cart abandonment statistics show us that three-quarters of people who abandon shopping carts intend to return. So, it’s up to the online retailer and marketer to figure out how to entice them to come back. Wishlists are a good strategy to combat the high rate of new visitor shopping cart abandonment.
Source: SeeWhy
7. 81% of the organic traffic of eCommerce sites comes from Google
The source of the traffic to your store is one of the most significant pieces of information you need to know. Google accounts for more than four out of every five organic shoppers. Bing has 13.6 percent, Yahoo 9.6 percent, and AOL 1.7 percent of the market.
Shopping Cart Abandonment Statistics for Abandonment Reasons
What causes shoppers to second-guess their purchases? You might be surprised by some of the reasons.


Source: Baymard Institute
1. The number of checkout form elements must be 12 at most
According to research on the effect of the checkout form’s complexity on the average cart abandonment rate, the number of items should be kept to a tolerable amount of 12. By the time you reach 12, you’ve already begun to test the patience of the majority of your clients.
Understanding user frustration requires some kind of information that can’t be gathered that easily and needs some help. There are services that enable you to track every movement of your customers. Our choice is WatchThemLive analytics.
Our user tracking service is the ideal choice for this matter. You can use this service to track every detailed movement of your customers and see when they are getting frustrated and leave your website. Therefore, you can make better decisions to lower your shopping cart abandonment rate.
Make sure to sign up for free and get benefits from using WTL.
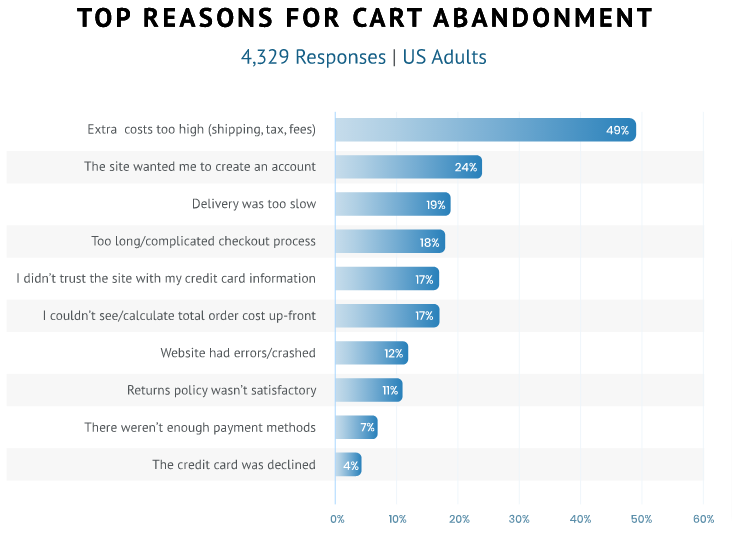
2. 61% of shoppers leave a transaction due to an extra cost
If a significant number of shoppers mention a specific concern, it means marketers should concentrate on it.
For example, when faced with additional delivery expenses, roughly 55 percent to 61 percent of buyers questioned admitted to abandoning a transaction. According to Forrester Research, 40 percent of visitors abandon their shopping carts because delivery is not free.
3. A slow website can increase abandonment by 75%
Slow-loading websites have grown increasingly irritating to internet users.
According to shopping cart abandonment statistics, even if you have everything else right, a few seconds delay in page loading can cause potential clients to abandon your site.
Furthermore, many of those who left would never return.
Source: Annex Cloud
4. 25% of shoppers say PayPal has the best security
The Sense of security is not the same as the sense of familiarity. According to studies on eCommerce cart abandonment, despite having a low level of familiarity, PayPal gives buyers a greater sense of security.
Surprisingly, age influences which badge makes customers feel more secure. Older buyers are more likely to trust PayPal, while millennials are more likely to trust the Google Trusted Store label.
Source: ConversionXL
5. 35% of individuals will abandon a site without a security badge
Shopping cart abandonment statistics demonstrate that trust is another critical aspect for online shoppers, especially when sharing personal information throughout the transaction. The most common approach to represent security is through security badges, often known as trust logos or site seals.
Conclusion
It can seem worrying that seven out of ten customers will abandon their shopping cart. However, it is undeniably a problem that can be resolved. These shopping cart abandonment statistics reveal some of the most prevalent reasons why customers leave their carts, as well as the areas where businesses should concentrate their efforts.
By addressing these critical issues, you should be able to lower your cart abandonment rate and divert a large majority of shoppers who don’t complete their purchase on the first try.

