Page Contents
Tracking product metrics is essential as they can tell you what customers think and feel about your product. You can also find out how much business value the product is creating.
Now, you might be asking which metrics you should exactly be tracking? Well, the answer to this question is different for each business depending on their product, goals, and many other factors. However, in this blog post, we will discuss the most important metrics and how to calculate each after explaining what product metrics are and why they are important. If you are also looking for a great tool to track these metrics, you can sign up for WatchThemLive for FREE and understand users’ behavior and interactions. So, let’s dive in.


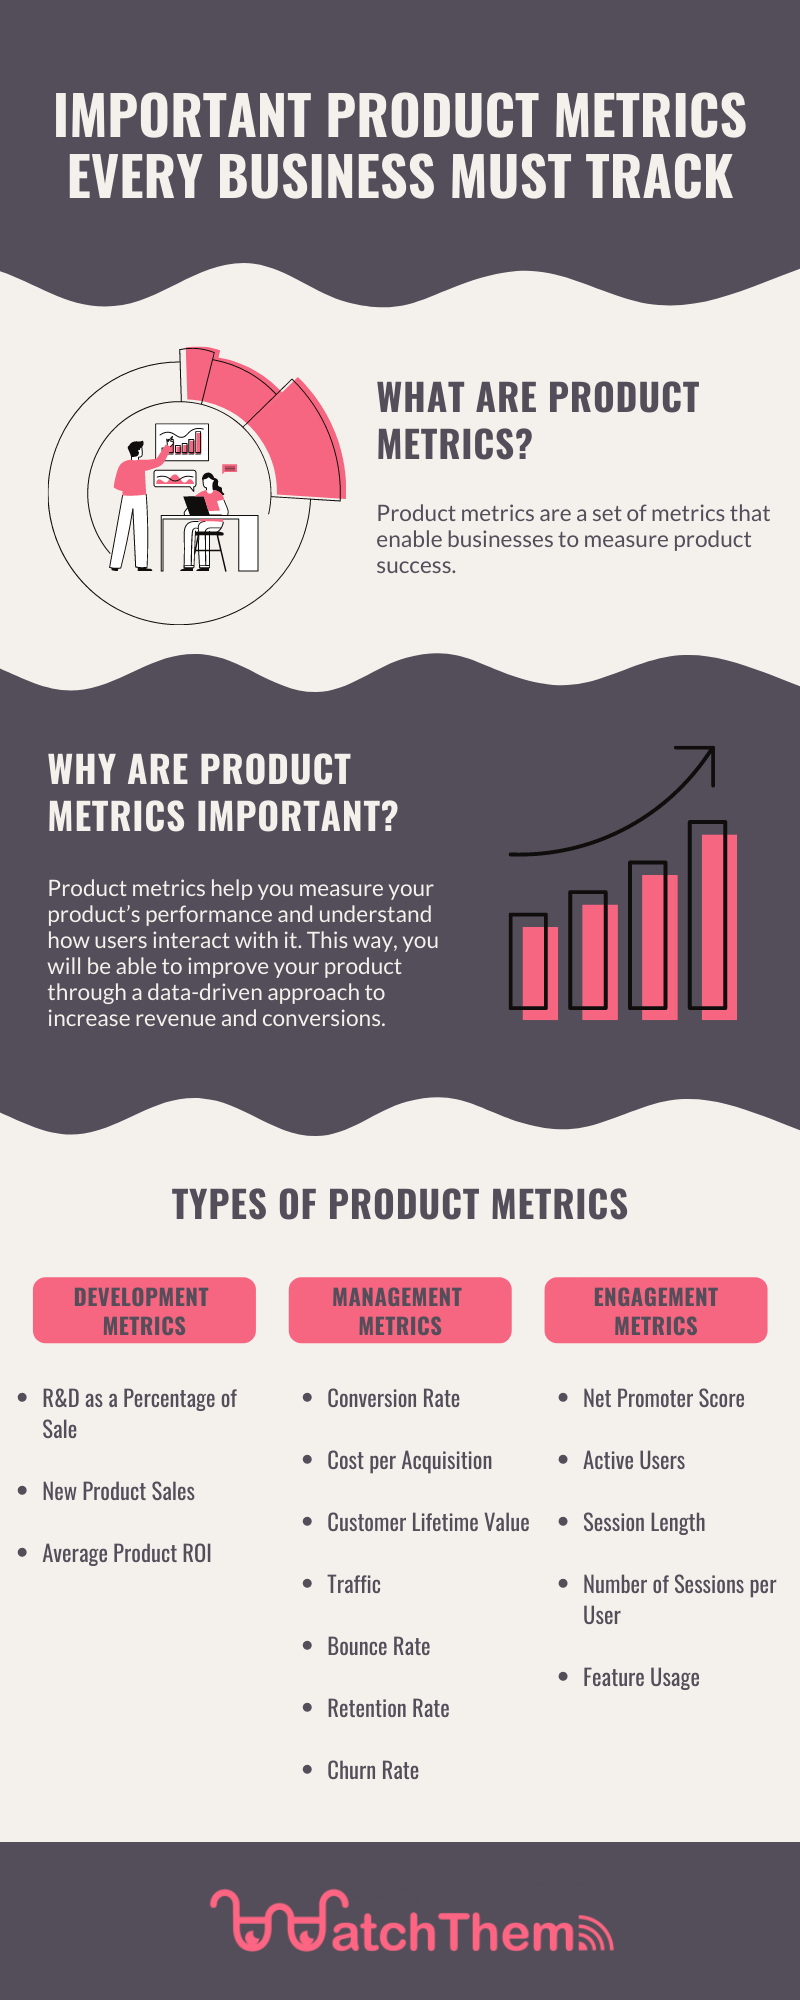
What Are Product Metrics?
Product metrics are a set of metrics that enable businesses to measure product success. Businesses can understand how users interact with their website, app, or digital product by tracking and analyzing these metrics. Understanding these interactions is necessary as they determine how successful your product is and what you should do to improve it.
Why Are Product Metrics Important?
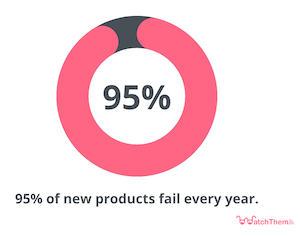
The fact that 95% of new products fail highlights the importance of tracking product metrics. Without these metrics, businesses won’t have any idea how their product is performing. There’s no better way to understand users’ interactions with your product than analyzing these metrics.


Moreover, product KPIs allow you to make more informed decisions about your product and its development process. You can find out which features are working out and resonating with the users and which ones are not. This way, you will be able to improve your product according to users’ needs and behavior. Also, by analyzing these metrics, you can eliminate the guesswork from product development.
What Is the Purpose of Product Metrics?
Businesses track product metrics for many reasons. Keeping an eye on these metrics is the most efficient way to track performance changes and identify areas for improvement.
Let’s take a look at some of the most important reasons companies use product KPIs:
- Creating a better product roadmap
- Improving the product strategy
- Understanding user behavior
- Segmenting the target market
- Forecasting revenue growth rate
- Measuring the success of product features
- Measuring product launch success
How Can Product Metrics Help You?
Let’s take a look at some of the benefits of tracking product metrics:
1- Building Product Team Alignment
The metrics will help you ensure that all the product team members aim for the same goals and objectives. The team members will communicate and manage disagreements more effectively as everyone is in agreement with the process.
2- Making More Informed Decisions
Analyzing these metrics is an excellent way to understand if your product is aligned with customers’ needs or not. It will give invaluable insights into how to improve product development and management processes.
Furthermore, you will be able to prioritize features and product improvements more easily and design a more effective product strategy.
3- Increasing Revenue and Conversions
These metrics help you improve your product to fulfill your customers’ needs better. Therefore, customers will be more likely to buy your product. This leads to revenue growth and more conversions.
4- Reducing Churn Rate
As you focus on product enhancements, customer satisfaction increases. This means customers will be less likely to leave your product. As a result, your retention rate and customer lifetime value will increase, which will boost revenue growth as well.
What Are the Product Metrics You Should Track?
Here we are going to take a look at the types of product metrics. We have categorized them into three groups:
1- Product Development Metrics
Tracking this type of metric will help you understand how to create your product and improve its quality effectively.
1- Research and Development (R&D) Spending as a Percentage of Sales
This metric indicates how much companies spend on research and development when building or improving a product. Generally, the more you spend on product research and development, the more satisfying your product will probably be. Therefore, you can win customers’ hearts more easily and stand out from the crowd.
To calculate the R&D metric as a percentage of sales, divide your research and development expenses by sales, then multiply it by 100.


2- New Product Sales
This metric refers to the amount of revenue you generate from a newly released product. New product sales can tell you if your new products are helping the growth of your business or not. If the sales are low, it means the product isn’t adding value to your business.
3- Average Product ROI
The average product ROI shows how much revenue a new product generates and will help you calculate the profit margin.
2- Product Management Metrics
Product management KPIs help companies measure the effectiveness of their product strategy and if they are achieving their product goals.
1- Conversion Rate
Conversion rate indicates the percentage of users who complete the goal in your product. You can determine how successfully your product leads users to take the desired action by tracking this metric.
Divide the number of conversions by the total number of users and multiply it by 100 to calculate your conversion rate.


A great way to track conversions is using a user tracking tool such as WatchThemLive. The goal tracking feature allows you to create conversion goals to find out the percentage of users who complete the goal. This tool also helps you track other product metrics such as traffic, bounce rate, session length, etc. that we will discuss further below.
Start tracking product metrics with WatchThemLive now! Sign up for FREE and boost sales.
2- Cost per Acquisition
Cost per acquisition (CPA) is the cost of acquiring a new customer. This metric can help to make better pricing decisions. You can calculate this metric by dividing the total marketing costs for your product by the number of customers you acquired through these marketing efforts.


3- Customer Lifetime Value
Customer Lifetime Value (CLV) shows how much profit an average customer generates for your business during their relationship with your company. This metric helps you understand the reasonable amount to spend on acquiring new customers.


4- Traffic
By tracking your organic and paid traffic, you can figure out which marketing channels are more effective for your business. Knowing which ones bring you more valuable traffic will help you invest in the right channels and develop successful strategies.
5- Bounce Rate
This metric indicates the percentage of users who leave your website after visiting one page of your website or app without performing any action. Bounce rate helps you find out the pages that need improvement to attract more attention. However, a high bounce rate doesn’t always mean you should optimize your pages. It could also indicate that you are attracting the wrong users.
To calculate your bounce rate, divide the single-page visits by the total visits and multiply it by 100.


6- Retention Rate
Retention rate refers to the percentage of users who continue using your product in a specific time frame. Creating a product that keeps users coming back is a sure-fire way to improve your bottom line. In fact, if you increase customer retention by 5%, your profit can increase by more than 25%.
You can calculate the retention rate by subtracting the number of acquired customers during a specific period from the number of remaining customers at the end of that period. Then, divide it by the number of customers at the beginning of the period and multiply it by 100.


7- Churn Rate
The churn rate measures the percentage of users you have lost during a specific period of time. This metric can help you determine your success when it comes to customer satisfaction.
You can easily calculate the churn rate by dividing the number of lost customers by the total number of customers at the start of a specific period and multiplying it by 100.


3- Product Engagement Metrics
Product engagement metrics can tell you how users interact with your product and if they are satisfied. These metrics give you insights into which parts of your product are more engaging.
1- Net Promoter Score
Net promoter score (NPS) measures the number of customers who are likely to recommend you as well as the number of detractors. To calculate your NPS, you have to subtract the percentage of your detractors from the percentage of your promoters.
You can find the number of your promoters and detractors by asking users to rank the product from 0 to 10. The detractors are the ones who give your product from 0 to 6. The ones who give it from 7 to 8 are neutrals, and the promoters are those who rank it from 9 to 10.


2- Active Users
The Active users metric indicates the number of users who use your product during a particular time period. This metric is usually calculated daily, weekly, and monthly. Remember that you need to determine what active users mean for your product. You can define it as users who open your app or as ones who perform a specific action, for example.
3- Session Length
This metric tells you how much time users spend on your product. Keep in mind that a long session duration doesn’t always mean users are engaging with your product. Sometimes, it can be a sign of user confusion, for example.
4- Number of Sessions per User
This metric refers to the number of times a user has used your product. The more the user comes back to your product, the more likely they will stay loyal. It is also an indication of how popular your product is.
5- Feature Usage
With this metric, you can figure out the percentage of users who use each feature of your product. This way, you will know which features matter most to your users to prioritize them and remove the useless ones.
To calculate this metric within a specific period, you have to divide the number of users who used the feature by your total number of users.


Conclusion
Tracking product metrics is necessary to ensure your product’s success. However, there are tons of metrics out there, and tracking all of them will be overwhelming rather than helpful. Therefore, you need to choose the metrics based on your business goals and the product you are offering.
Product metrics are important as they help you measure your product’s performance and understand how users are engaging with it. This way, you will be able to improve your product through a data-driven approach to increase revenue and conversions. Furthermore, the metrics help you align your product team’s goals and priorities.
In this article, we grouped product KPIs into three categories: development, management, and engagement metrics. For each category, we discussed the most important metrics and how to calculate them.
Make sure to keep an eye on these metrics to ensure the best possible product. Also, you can get help from a behavior analytics tool such as WatchThemLive to analyze users’ behavior and understand how they interact with your product. So try it for FREE now!

