Page Contents
Countless online stores have started their work in the past few years, and the number is still increasing. The business is booming, and the competition is tight. So, to uplift your online business and stay ahead of your competitors, you must look for any possible way to improve.
There’s a famous saying by Peter Drucker, one of the most influential management consultants in the world, which reads, “You can’t improve what you don’t measure.” So the first step to improvement is finding appropriate tools to collect data.
This article introduces the best eCommerce analytics tools that help you gather vital information about your business and use it to make the kind of changes that will pave your way to success.
WatchThemLive has features to help you track your visitors’ every move to help you enhance their experience and increase your conversion rate. SIGN UP for FREE now!
What Is E-commerce Analytics?
Before we start talking about analytics tools for eCommerce, you should first know what eCommerce analytics is. eCommerce analytics is the act of gathering all forms of data that might affect your online shop and analyzing it to see how your customer’s behavior is changing. Then you can utilize this information to make the appropriate modifications to boost your sales.
How Can eCommerce Analytics Tools Improve Your Business?
In fact, studies show that nearly 97% of organizations have implemented analytics. The most desired outcomes are the opportunity to cut expenses, boost profitability, and improve risk management.
Best eCommerce Analytics Tools to Boost Sales

The importance of analytics and its enormous impact on the success of a business is not something to be overlooked. That is why the need and demand for powerful eCommerce analytics tools are increasing day by day. Plenty of eCommerce analytics software has been designed and is available, each providing its unique features to satisfy the drastic increase in the quest for data. Below, we will go through five of the best eCommerce analytics tools and explain their features and pros and cons.
WatchThemLive
WatchThemLive is a great tool that will help you better understand your user behavior on your website. This tool has various services, including analytics, heatmaps, session recording, user tracking, etc. These services give you specific information about how your users interact with your website. Using them, you will optimize your online business in the best way and maximize your conversion rate. Now let’s take a look at each of these services and see what type of data they can provide you with.
Analytics
It doesn’t matter whether you’re the owner of a business, a designer, a marketer, etc. Somehow analytics will find its way to your field of activity! WatchThemLive analytics gives you tons of helpful information about your website and your visitors, such as:
- A ranked list of all of your pages sorted by the number of visitors each one has had
- A list of domains that have led visitors to your website, again, sorted by the number and percentage of visitors
- The percentage of users that have visited your website from each country
- The performance of your marketing campaigns via UTMs
- Statistics on your users’ operating systems, devices, browsers, screen resolution, and browser language
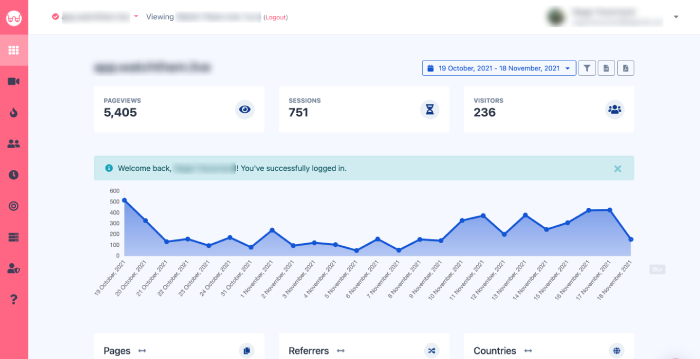

Moreover, WatchThemLive gives you the option to see data in customized periods and compare them to each other. It helps you come to a deeper understanding of the changes your business has gone through in different times and foresee what’s yet to come. You can also export all of this data in PDF or CSV format. So you can gather all your data and have it in one place, making it easier to analyze.
This information shows you the big picture and helps you optimize your website in the best way possible.
Session Recording
WatchThemLive also lets you watch every move of your users, from clicks to mouse movements. It can show you 5 thousand session replays per month in its free plan and up to 5 million per month in its enterprise plan. Another thing that makes WatchThemLive session replays even more fascinating is the option to filter the recorded sessions by your visitors’ devices (desktop, tablet, or mobile,) their browsers, screen resolution, etc. This way, you can focus on different aspects of your design more efficiently.
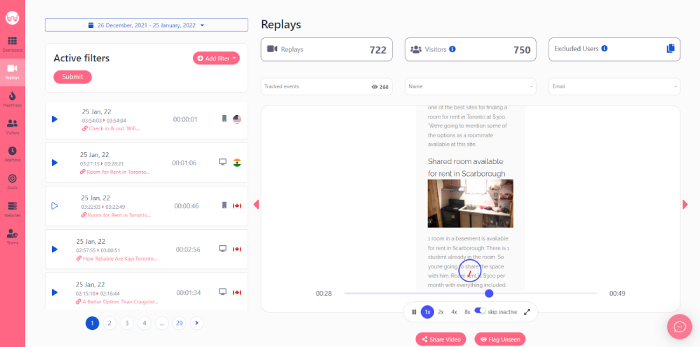

By studying your visitors’ journeys and how they navigate your website, you will acquire a perfect understanding of your users and use this knowledge to make their experience better and more personalized.
Heatmaps
Heatmaps show you the density of clicks and taps on different parts of your website so you can choose the best position for your important buttons and CTAs.
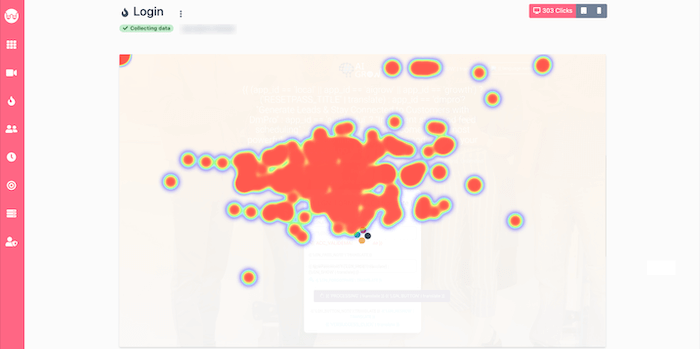

Furthermore, this data visualization method helps you determine whether your design is engaging enough for your visitors and how efficiently they interact with it. If analyzed and exploited correctly, these insights will result in an improvement in your website usability and a higher CTR and conversion rate.
Heatmaps for desktop, tablet, and mobile devices are available on WatchThemLive, and you can have an unlimited number of heatmaps for FREE.
Sign up for FREE and join WatchThemLive for unlimited heatmaps and many other valuable features.
Goal Tracking
One of the great features that WatchThemLive offers is its goal tracking tool. You can use this tool to define conversion objectives to track your marketing performance and see how many visitors take the required action. Therefore, it allows you to assess the success of your marketing efforts.
Analyzing the data provides insights into optimizing your marketing plan to increase conversions. You will find out what you need to do to attain your company goals by tracking your goals.
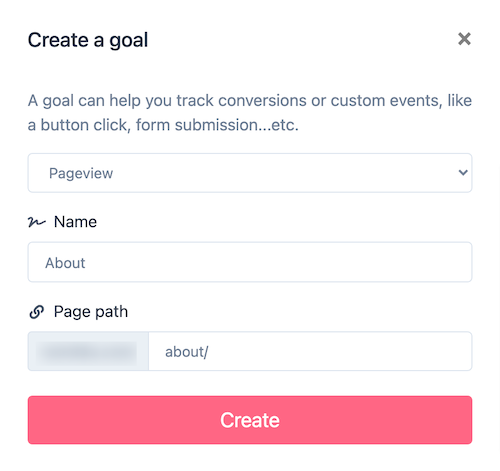

A goal is something that you want to track that the already existing analytics are not tracking. It might be anything from a single button click to downloads and particular page views (such as a thank-you page after a purchase), and so on. WatchThemLive lets you set unlimited goals and track them for free.
WatchThemLive: Pros
- Intuitive Interface
- Realtime analytics
- Data exportation
- Integration with link-in-bio page tools (MyURLs.bio)
- Unlimited heatmaps, goal tracking, and team members
- Free plan
- Annual plans with discounts
WatchThemLive: Pricing
WatchThemLive offers a free plan that includes 5,000 session replays and unlimited heatmaps and team members. The tiers and their prices are listed as follows:
- Pro – $9 per month
- Advanced – $39 per month
- Enterprise – $149 per month
To save a great deal of money, you can purchase annual or lifetime plans. You will also get more discounts on multiple website purchases.
Google Analytics
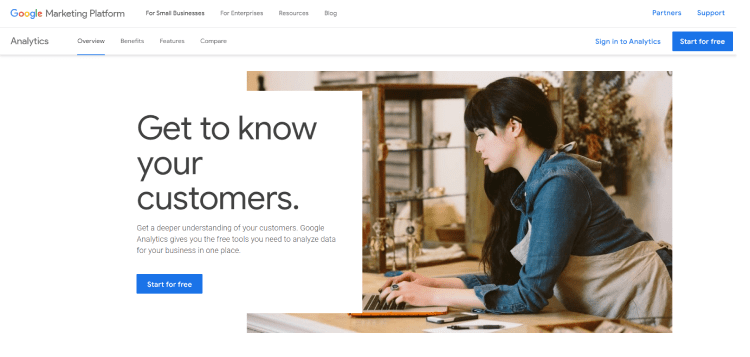

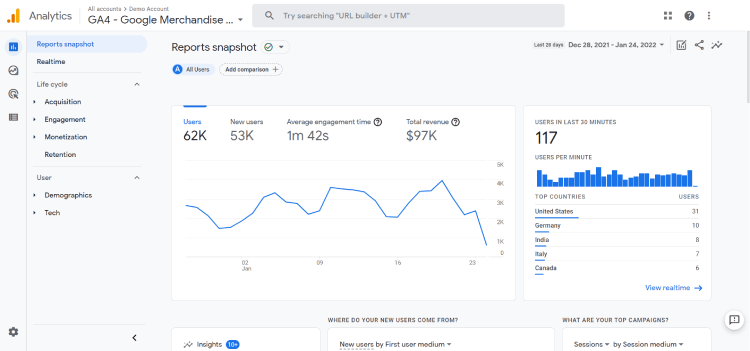
Google Analytics is used to track a website’s performance and gather information about its visitors. Using google analytics, you can see from what sources most of your user traffic comes. It also helps you assess your marketing activities and campaigns, track goal completions, identify patterns in the way your users engage with your website, and get other types of visitor data like demographics.
Many small and medium-sized retail websites use Google Analytics to collect and analyze various customer behavior analytics to improve their marketing campaigns, drive website traffic, and better retain visitors. Moreover, Google Analytics provides statistics and essential analytical tools for SEO and marketing purposes, and it’s a part of the Google Marketing Platform.

Google Analytics: Pros and Cons
Pros:
- Real-time traffic data
- Showing where the traffic comes from
- Tracking campaigns
- Exporting to Excel
- Ranking pages by popularity
Cons:
- Since it’s a large and complex system, It takes so much time to get a grasp of what’s what in Google Analytics.
Google Analytics: Pricing
Google Analytics is accessible for free to everyone. Although there is a paid version of Google Analytics called Analytics 360, all the features that a small or medium-sized online business needs is available in the free version. The price for GA 360 starts at $150,000 per year.
Here are some differences and similarities between the free and paid versions of GA:
Similarities:
- Real-time data
- Creating custom reports
- Custom dimensions
- Event tracking
- Content groupings
- Creating different properties and views
- Reporting on mobile, video, and social devices
- Goal creation
Differences:
- Sampling is the most significant distinction between GA and GA360. The term “sampling” refers to creating a subset of data to represent the overall trends and patterns of a larger dataset. In GA360, sampling happens at the 500,000 session threshold, whereas in GA, sampling occurs near the 100,000,000 session mark.
- GA 360 has a monthly hit limit of 20 billion, compared to GA’s ten million monthly hit limit. Any interaction that sends data to Google Analytics is considered a hit (for example, when a user’s activity triggers a tracking code.) The 10-million user hit limit in Google Analytics can be a stumbling block for many users, preventing the creation of ‘catchall’ event tags, which capture all actions on a website.
- GA 360 allows you to export up to 3,000,000 rows, whereas standard Google Analytics only allows you to export 50,000.
- GA 360 offers up to 200 configurable dimensions and metrics, while GA offers only 20. A custom dimension and metric in Google Analytics are user-created measurements that aren’t automatically defined inside Google Analytics, giving GA360 more freedom and creativity.
Recommended Reading: Google Analytics Heat Mapping in 2022: Complete Review and Alternatives
Microsoft Clarity
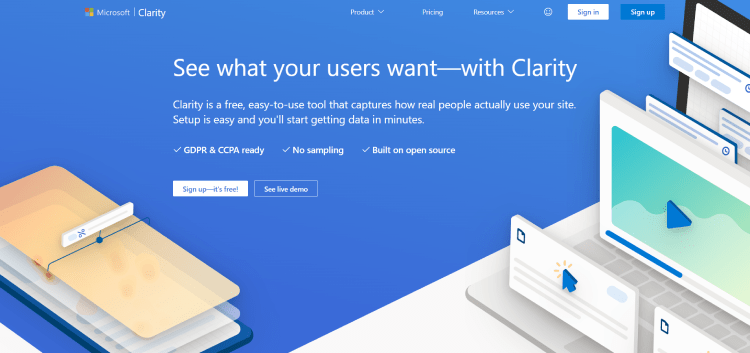

Microsoft Clarity provides detailed information on visitor behavior to help website owners improve their user experiences. In other words, Clarity is a behavioral analytics tool that uses features like Heatmaps, Session Playbacks, and Insights to help you understand what people are doing on your site.
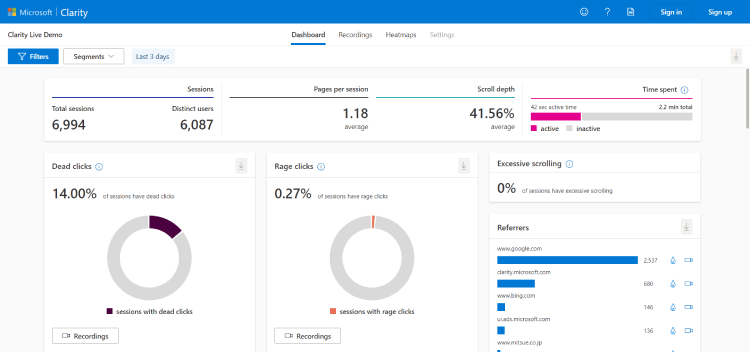

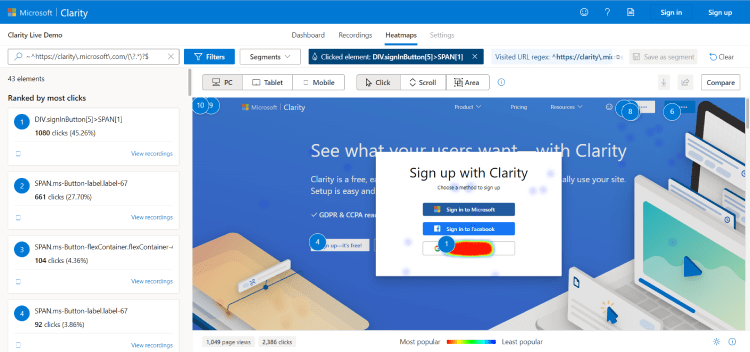
Clarity can show you which parts of your website have been engaging the most and least to the visitors. Clarity is a good tool if you want to understand your consumers without going through the mountains of data that come with running a website.

Microsoft Clarity: Pros and Cons
Pros:
- Real-time data processing
- No data sampling
Cons:
- No option for exporting reports
- No option for goal tracking
- Inefficient user profiling
Microsoft Clarity: Pricing
This tool is entirely free. Microsoft claims that they analyze a large quantity of anonymous data about user activity to gather insights and develop the machine learning models that underpin many of its products and services. Clarity is one of the ways Microsoft collects this vital information, which is why they’ve made it free.
Matomo
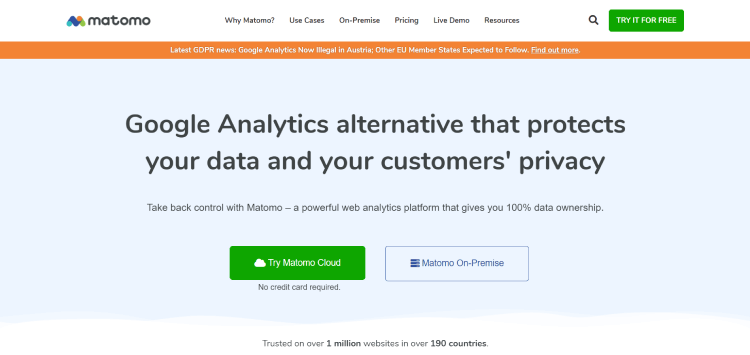

Matamo offers you valuable information about your website’s visitors and their interactions.
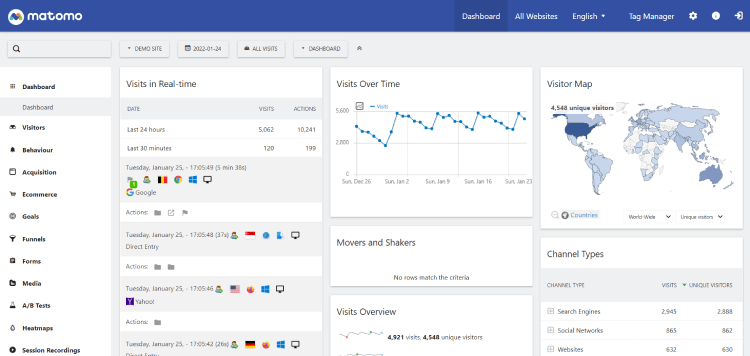

Matomo was formerly called Piwik. The company relaunched the tool as Matomo in January 2018.
Matomo: Pros and Cons
Pros:
- Using the API to construct custom reports
- Annual plans with discounts
Cons:
- Not all data is transmitted by search engines
- It’s sometimes hard to find some of the options
Matomo: Pricing
Matomo is a free program, and it doesn’t have a monetary cost. Although, if you want the cloud-hosted service of Matomo to provide you with a secure and reliable analytics solution, you should pay for their “cloud” plan. Its price varies based on your monthly traffic, starting from $23 to $16,900 per month.
Mixpanel
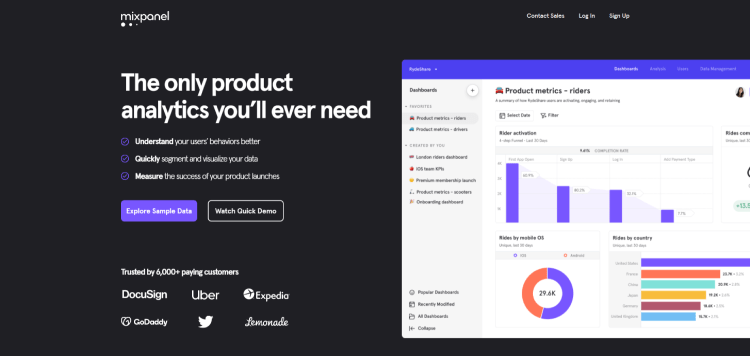

Mixpanel is a platform that focuses on behavioral analytics, testing, and customer experience improvement. Data reporting is one of Mixpanel’s most powerful features. It enables marketers to do in-depth analyses of user behavior and track KPIs to provide better customer experiences and improve revenue.
Mixpanel also provides unique indicators such as account health, lifetime value of business assets, and adoption.
Mixpanel: Pros and Cons
Pros:
- A/B Testing
- Autotrack
- Versatile Data Visualization
Cons:
- It’s difficult for new users and for trainees to use
Mixpanel: Pricing
Mixpanel has three plans available.
- Starter: It’s free for up to 1,000 monthly tracked users. It allows an unlimited number of team members.
- Growth: It costs $89 per month and can track up to 25,000 users per month.
- Enterprise: It’s priced custom to each client.
Conclusion
Each eCommerce business will have its particular requirements when it comes to gathering data and information about user behavior. The eCommerce analytics tools mentioned above are not the only available tools, but they are definitely among the best. You should consider your needs and the type of information you need to gather and analyze to find what tool/tools you should start using.
WatchThemLive makes it easy to track and understand exactly what your users do on your website using powerful features. With its easy setup, it provides real-time visualizations of your users’ behavior as they interact with your website or application, giving you valuable utilization data that can increase your conversions in no time. So sign up right now FOR FREE!

