
Page Contents
Last updated: October 2026
A landing page can look great and still lose money. The only way to know is to measure it. Landing page metrics show how many people arrive, what they do, where they leave and how much each conversion costs. With a small set of numbers, you can tell whether a page is working, find the weak spots and decide what to test next.
This guide explains what landing page metrics are, why they matter, how to judge a good conversion rate and seven metrics to track in 2026, including how they work in GA4. Where figures come from secondary summaries and vary, we say so. For the page itself, see our landing page checklist.
What Are Landing Page Metrics?
Landing page metrics are measurements of the performance of a page built to drive one action, such as a purchase, a sign-up or a form submission. They fall into three groups:
- Traffic metrics: how many people arrive and where they come from.
- Engagement metrics: what visitors do on the page, such as scrolling, clicking and staying.
- Outcome metrics: how many complete the goal and what each result costs.
Why Are Landing Page Metrics So Important?
- They show where money leaks. A page with strong traffic but few conversions wastes ad spend.
- They guide testing. Metrics tell you which element to improve, so tests start from evidence. See landing page testing.
- They compare campaigns and sources, so you can shift budget to what works.
- They link design to results, which helps justify changes to stakeholders.
What Is the Key Indicator of a Good Landing Page Conversion Rate?
The conversion rate is conversions divided by visitors, times 100, but a “good” rate depends on industry, traffic source and offer. Unbounce’s 2024 Conversion Benchmark Report, based on over 41,000 landing pages, reported a median landing page conversion rate of about 6.6% across industries. Summaries of the same report list industry medians from about 2.35% for e-commerce to above 12% for events and entertainment, so a single “good” number does not exist. The most useful comparison is your own history, split by traffic source and device. A rising trend with stable lead quality is the real sign of a good page.
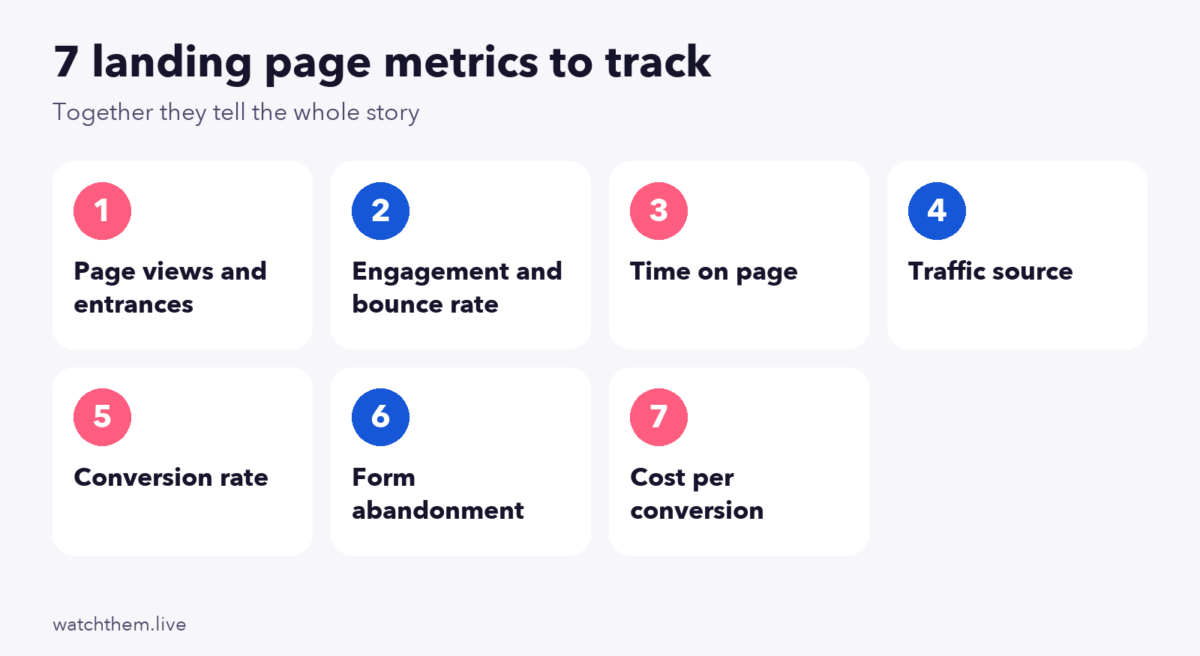
7 Crucial Landing Page Metrics to Track
1. Page Views and Entrances
Page views show how many times the page was loaded, and entrances show how many sessions started there. They are the base for every rate, so check them first. Sudden drops can mean a broken ad link or a tracking problem, and sudden spikes may be bot traffic. Track them by source, device and campaign.
2. Engagement Rate and Bounce Rate
In GA4, a session counts as engaged if it lasts longer than 10 seconds, includes a key event or has two or more page or screen views. Engagement rate is the share of engaged sessions, and bounce rate is simply 100% minus the engagement rate. Because this differs from the old Universal Analytics definition of a single-page visit, you should not compare GA4 bounce rates with old reports. On a landing page, a high bounce rate often points to message mismatch with the ad, slow loading or an unclear offer.
3. Time on Page and Scroll Depth
GA4 reports average engagement time, which counts the time the page was in the foreground and active. A very short time suggests that visitors do not find what they came for. A very long time on a simple page can signal confusion. Scroll depth shows how far visitors read. A heatmap with scroll tracking shows where interest fades; see website heatmaps and below the fold design.
4. Traffic Source
Compare conversion rate by source: paid search, social, email, organic and referral. Roundups generally rank referral and email higher and social lower, though exact numbers vary by source. Use UTM parameters on every campaign link so you can see which source, ad and keyword brought each converting visitor. See website metrics for traffic basics.
5. Conversion Rate
The main outcome metric. Calculate it for each source, device and variation, and track it over time. In GA4, this appears as session key event rate or user key event rate, because Google renamed conversions to key events in 2024. See what is conversion rate and how to calculate conversion rate.
6. Form Abandonment Rate
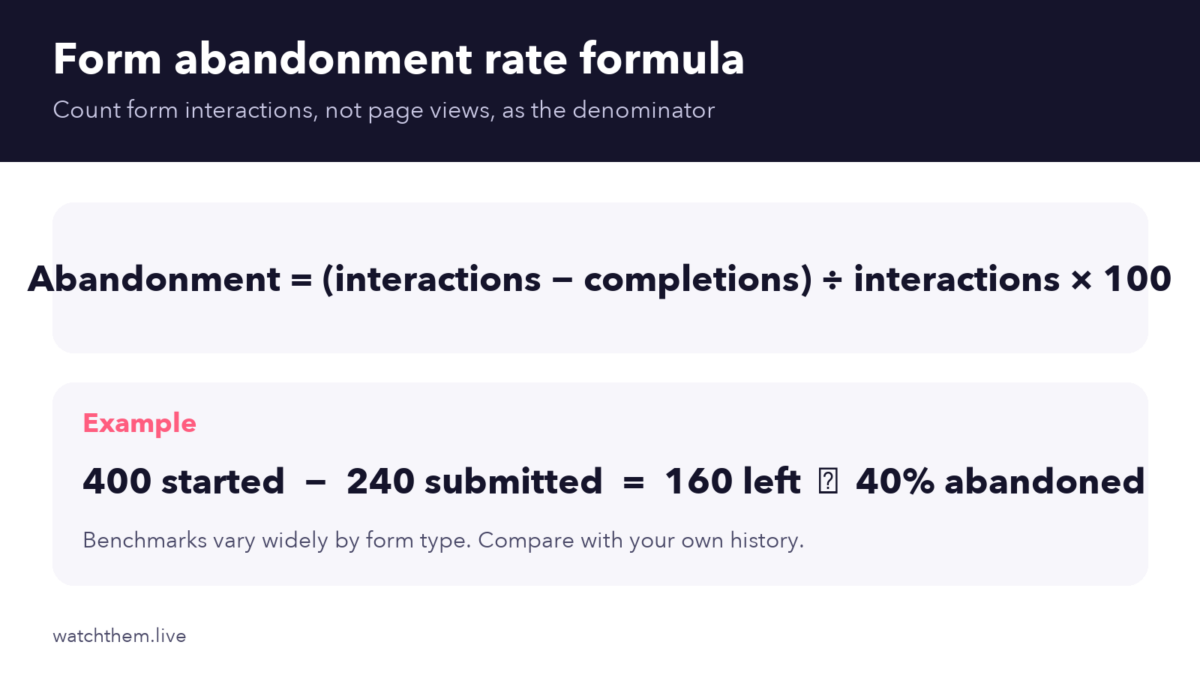
For pages with forms, this shows how many people start but do not finish. The formula is (form interactions minus completions) divided by form interactions, times 100. Using page views as the denominator inflates the rate. Benchmarks vary widely between sources, with one vendor putting completion for content download forms at 50% to 70% and detailed quote forms at 20% to 40%, but these come from marketing blogs, so compare with your own baseline.
To reduce abandonment, shorten the form, mark required fields clearly, show helpful error messages and explain what happens next. HubSpot’s analysis of more than 40,000 landing pages found that multiple text areas and drop-downs lowered conversions most, and a VWO test showed that removing three fields raised conversions by 11%. Recordings show which field makes people quit.
7. Cost per Conversion
Divide the spend on a campaign by the number of conversions. It shows whether the page is profitable and sets a limit on what you can pay for traffic. For lead pages, also track cost per qualified lead, not just cost per form submission. See cost per lead and funnel metrics.
Other Metrics Worth Watching
- Page speed and Core Web Vitals. Google’s targets are a Largest Contentful Paint of 2.5 seconds or less, an Interaction to Next Paint of 200 milliseconds or less and a Cumulative Layout Shift of 0.1 or less. A Deloitte study for Google found that a 0.1-second mobile speed gain lifted retail conversion by about 8.4%.
- Click-through rate on the main button, to separate “did not see the button” from “did not want it.”
- Device split. Mobile is roughly 60% to 63% of global web traffic, according to Statcounter data for 2025.
- Revenue per visitor, to judge quality, not just quantity.
- Lead quality and speed of follow-up. Contacting a web lead within five minutes made it about 21 times more likely to be qualified than waiting 30 minutes in the Lead Response Management study. See lead conversion.
Best Tools for Tracking Landing Page Metrics
- Analytics such as GA4 for traffic, events and conversions, with key events set for your main goal.
- Behavior tools for the why: session recordings, heatmaps and goal and event tracking.
- Experiment tools to run A/B tests. Google Optimize shut down on September 30, 2023, so use a third-party platform. See CRO tools.
- Dashboards that combine ad cost and conversions.


How to Use Landing Page Metrics
- Set one primary goal and mark it as a key event.
- Review the metrics weekly by source and device.
- Find the biggest gap, such as high bounce from one ad or high form abandonment on mobile.
- Diagnose with recordings and heatmaps.
- Write a hypothesis and test it. Avoid the common errors in landing page testing mistakes.
- Record the result and repeat.
A Simple Landing Page Metrics Dashboard
You do not need a complex report. A one-page dashboard with these rows is enough for most teams:
- Traffic: entrances by source and device, with the change from last week.
- Engagement: engagement rate, average engagement time and scroll depth.
- Outcomes: conversion rate, form starts, form completions and abandonment rate.
- Money: spend, cost per conversion and, if possible, revenue per visitor or cost per qualified lead.
- Speed: Largest Contentful Paint and Interaction to Next Paint for mobile.
Add a notes row for changes, such as a new ad, a page update or a promotion, so you can explain shifts when you review the numbers.
Common Landing Page Metrics Mistakes
- Tracking only page views. Traffic without conversions is not success.
- Mixing definitions, such as sessions and users, or UA and GA4 bounce rates.
- Ignoring segments, so averages hide a weak mobile page or a weak ad.
- Not tagging campaigns, which leaves traffic as “direct.”
- Judging too early, before there is enough data.
- Optimizing for cheap leads that never become customers.
Frequently Asked Questions About Landing Page Metrics
What are the most important landing page metrics?
Conversion rate, traffic source, engagement or bounce rate, form abandonment and cost per conversion, supported by page views, time on page and page speed.
What is a good landing page conversion rate?
Unbounce’s 2024 report put the median at about 6.6% across industries, with large differences by sector. Compare with your own history and your industry.
How is bounce rate different in GA4?
GA4 defines bounce rate as 100% minus engagement rate, where an engaged session lasts over 10 seconds, has a key event or has two or more page views. It is not the same as the old single-page-visit definition.
How do I calculate form abandonment rate?
Subtract completions from form interactions, divide by form interactions and multiply by 100. For example, 400 starts and 240 submissions equal 40% abandonment.
How often should I check landing page metrics?
Review main numbers weekly and check them right away after a campaign launch or a page change.
In Conclusion
Landing page metrics tell you whether a page does its job. Track traffic, engagement, conversion rate, form abandonment and cost per conversion, segment them by source and device and use recordings and heatmaps to understand the reasons. Then test one change at a time and record the results. Steady, measured improvements make every ad click more valuable.
